The Hartford 2015 Annual Report Download - page 111
Download and view the complete annual report
Please find page 111 of the 2015 The Hartford annual report below. You can navigate through the pages in the report by either clicking on the pages listed below, or by using the keyword search tool below to find specific information within the annual report.-
 1
1 -
2
-
3
-
4
-
5
-
6
-
7
-
8
-
9
-
10
-
11
-
12
-
13
-
14
-
15
-
16
-
17
-
18
-
19
-
20
-
21
-
22
-
23
-
24
-
25
-
26
-
27
-
28
-
29
-
30
-
31
-
32
-
33
-
34
-
35
-
36
-
37
-
38
-
39
-
40
-
41
-
42
-
43
-
44
-
45
-
46
-
47
-
48
-
49
-
50
-
51
-
52
-
53
-
54
-
55
-
56
-
57
-
58
-
59
-
60
-
61
-
62
-
63
-
64
-
65
-
66
-
67
-
68
-
69
-
70
-
71
-
72
-
73
-
74
-
75
-
76
-
77
-
78
-
79
-
80
-
81
-
82
-
83
-
84
-
85
-
86
-
87
-
88
-
89
-
90
-
91
-
92
-
93
-
94
-
95
-
96
-
97
-
98
-
99
-
100
-
 101
101 -
 102
102 -
 103
103 -
 104
104 -
 105
105 -
 106
106 -
 107
107 -
 108
108 -
 109
109 -
 110
110 -
 111
111 -
 112
112 -
 113
113 -
 114
114 -
 115
115 -
 116
116 -
 117
117 -
 118
118 -
 119
119 -
 120
120 -
 121
121 -
122
-
123
-
124
-
125
-
126
-
127
-
128
-
129
-
130
-
131
-
132
-
133
-
134
-
135
-
136
-
137
-
138
-
139
-
140
-
141
-
142
-
143
-
144
-
145
-
146
-
147
-
148
-
149
-
150
-
151
-
152
-
153
-
154
-
155
-
156
-
157
-
158
-
159
-
160
-
161
-
162
-
163
-
164
-
165
-
166
-
167
-
168
-
169
-
170
-
171
-
172
-
173
-
174
-
175
-
176
-
177
-
178
-
179
-
180
-
181
-
182
-
183
-
184
-
185
-
186
-
187
-
188
-
189
-
190
-
191
-
192
-
193
-
194
-
195
-
196
-
197
-
198
-
199
-
200
-
201
-
202
-
203
-
204
-
205
-
206
-
207
-
208
-
209
-
210
-
211
-
212
-
213
-
214
-
215
-
216
-
217
-
218
-
219
-
220
-
221
-
222
-
223
-
224
-
225
-
226
-
227
-
228
-
229
-
230
-
231
-
232
-
233
-
234
-
235
-
236
-
237
-
238
-
239
-
240
-
241
-
242
-
243
-
244
-
245
-
246
-
247
-
248
-
249
-
250
-
251
-
252
-
253
-
254
-
255
 |
 |

111
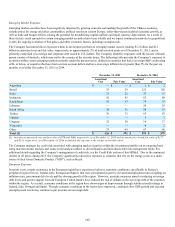
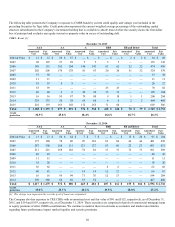
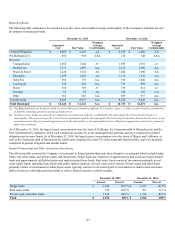
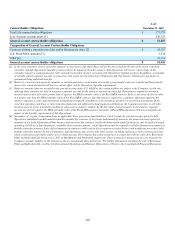
The following table presents the Company’s exposure to CMBS bonds by current credit quality and vintage year included in the
preceding Securities by Type table. Credit protection represents the current weighted average percentage of the outstanding capital
structure subordinated to the Company’s investment holding that is available to absorb losses before the security incurs the first dollar
loss of principal and excludes any equity interest or property value in excess of outstanding debt.
CMBS - Bonds [1]
December 31, 2015
AAA AA A BBB BB and Below Total
Amortized
Cost Fair
Value Amortized
Cost Fair
Value Amortized
Cost Fair
Value Amortized
Cost Fair
Value Amortized
Cost Fair
Value Amortized
Cost Fair
Value
2004 & Prior $ 12 $ 12 $ 50 $ 55 $ — $ — $ — $ — $ 2 $ 2 $ 64 $ 69
2005 98 107 27 28 5 5 5 5 — — 135 145
2006 149 151 102 104 140 141 61 62 22 22 474 480
2007 202 206 170 178 81 83 20 20 51 52 524 539
2008 37 38 — — — — — — — — 37 38
2009 11 11 — — — — — — — — 11 11
2010 18 19 8 8 — — — — — — 26 27
2011 55 59 — — — — 23 23 — — 78 82
2012 40 40 6 6 26 26 33 32 — — 105 104
2013 16 16 95 97 79 80 9 10 1 1 200 204
2014 329 335 58 58 69 68 6 6 2 2 464 469
2015 201 197 163 158 172 165 71 66 — — 607 586
Total $ 1,168 $ 1,191 $ 679 $ 692 $ 572 $ 568 $ 228 $ 224 $ 78 $ 79 $ 2,725 $ 2,754
Credit
protection 32.9% 25.8% 18.4% 16.6% 18.7% 26.3%
December 31, 2014
AAA AA A BBB BB and Below Total
Amortized
Cost Fair
Value Amortized
Cost Fair
Value Amortize
d Cost Fair
Value Amortized
Cost Fair
Value Amortized
Cost Fair
Value Amortized
Cost Fair
Value
2004 & Prior $ 13 $ 13 $ 58 $ 64 $ 7 $ 7 $ — $ — $ 15 $ 20 $ 93 $ 104
2005 175 188 78 80 99 101 83 84 46 46 481 499
2006 287 300 108 115 121 127 63 66 22 23 601 631
2007 211 221 169 182 78 82 31 31 72 73 561 589
2008 40 43 — — — — — — — — 40 43
2009 11 11 — — — — — — — — 11 11
2010 18 20 — — — — — — — — 18 20
2011 56 62 — — — — 6 6 — — 62 68
2012 40 41 — — 14 14 12 12 — — 66 67
2013 16 16 95 99 71 76 12 13 — — 194 204
2014 350 360 64 66 53 54 — — — — 467 480
Total $ 1,217 $ 1,275 $ 572 $ 606 $ 443 $ 461 $ 207 $ 212 $ 155 $ 162 $ 2,594 $ 2,716
Credit
protection 33.0% 25.7% 20.2% 19.5% 18.0% 27.2%
[1] The vintage year represents the year the pool of loans was originated.
The Company also has exposure to CRE CDOs with an amortized cost and fair value of $91 and $132, respectively, as of December 31,
2015, and $114 and $193, respectively, as of December 31, 2014. These securities are comprised of pools of commercial mortgage loans
or equity positions of other CMBS securitizations. We continue to monitor these investments as economic and market uncertainties
regarding future performance impact market liquidity and security premiums.