The Hartford 2015 Annual Report Download - page 193
Download and view the complete annual report
Please find page 193 of the 2015 The Hartford annual report below. You can navigate through the pages in the report by either clicking on the pages listed below, or by using the keyword search tool below to find specific information within the annual report.-
 1
1 -
2
-
3
-
4
-
5
-
6
-
7
-
8
-
9
-
10
-
11
-
12
-
13
-
14
-
15
-
16
-
17
-
18
-
19
-
20
-
21
-
22
-
23
-
24
-
25
-
26
-
27
-
28
-
29
-
30
-
31
-
32
-
33
-
34
-
35
-
36
-
37
-
38
-
39
-
40
-
41
-
42
-
43
-
44
-
45
-
46
-
47
-
48
-
49
-
50
-
51
-
52
-
53
-
54
-
55
-
56
-
57
-
58
-
59
-
60
-
61
-
62
-
63
-
64
-
65
-
66
-
67
-
68
-
69
-
70
-
71
-
72
-
73
-
74
-
75
-
76
-
77
-
78
-
79
-
80
-
81
-
82
-
83
-
84
-
85
-
86
-
87
-
88
-
89
-
90
-
91
-
92
-
93
-
94
-
95
-
96
-
97
-
98
-
99
-
100
-
101
-
102
-
103
-
104
-
105
-
106
-
107
-
108
-
109
-
110
-
111
-
112
-
113
-
114
-
115
-
116
-
117
-
118
-
119
-
120
-
121
-
122
-
123
-
124
-
125
-
126
-
127
-
128
-
129
-
130
-
131
-
132
-
133
-
134
-
135
-
136
-
137
-
138
-
139
-
140
-
141
-
142
-
143
-
144
-
145
-
146
-
147
-
148
-
149
-
150
-
151
-
152
-
153
-
154
-
155
-
156
-
157
-
158
-
159
-
160
-
161
-
162
-
163
-
164
-
165
-
166
-
167
-
168
-
169
-
170
-
171
-
172
-
173
-
174
-
175
-
176
-
177
-
178
-
179
-
180
-
181
-
182
-
 183
183 -
 184
184 -
 185
185 -
 186
186 -
 187
187 -
 188
188 -
 189
189 -
 190
190 -
 191
191 -
 192
192 -
 193
193 -
 194
194 -
 195
195 -
 196
196 -
 197
197 -
 198
198 -
 199
199 -
 200
200 -
 201
201 -
 202
202 -
 203
203 -
204
-
205
-
206
-
207
-
208
-
209
-
210
-
211
-
212
-
213
-
214
-
215
-
216
-
217
-
218
-
219
-
220
-
221
-
222
-
223
-
224
-
225
-
226
-
227
-
228
-
229
-
230
-
231
-
232
-
233
-
234
-
235
-
236
-
237
-
238
-
239
-
240
-
241
-
242
-
243
-
244
-
245
-
246
-
247
-
248
-
249
-
250
-
251
-
252
-
253
-
254
-
255
 |
 |

Table of Contents THE HARTFORD FINANCIAL SERVICES GROUP, INC.
NOTES TO CONSOLIDATED FINANCIAL STATEMENTS (continued)
6. Investments and Derivative Instruments (continued)
F-62
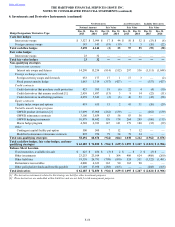
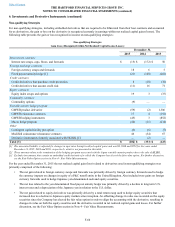
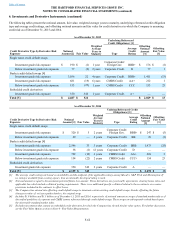
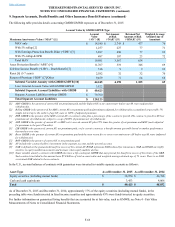
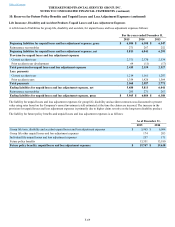
The following tables present the notional amount, fair value, weighted average years to maturity, underlying referenced credit obligation
type and average credit ratings, and offsetting notional amounts and fair value for credit derivatives in which the Company is assuming
credit risk as of December 31, 2015 and 2014.
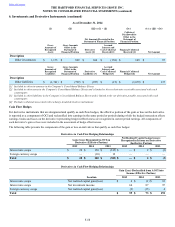
As of December 31, 2015 Underlying Referenced
Credit Obligation(s) [1]
Credit Derivative Type by Derivative Risk
Exposure Notional
Amount [2] Fair Value
Weighted
Average
Years to
Maturity Type
Average
Credit
Rating
Offsetting
Notional
Amount
[3]
Offsetting
Fair Value
[3]
Single name credit default swaps
Investment grade risk exposure $ 190 $ (1) 1 year
Corporate Credit/
Foreign Gov. BBB+ $ 176 $ (1)
Below investment grade risk exposure 77 (2) 2 years Corporate Credit B 77 1
Basket credit default swaps [4]
Investment grade risk exposure 3,036 22 4 years Corporate Credit BBB+ 1,411 (13)
Investment grade risk exposure 681 (19) 6 years CMBS Credit AA+ 212 1
Below investment grade risk exposure 153 (25) 1 year CMBS Credit CCC 153 25
Embedded credit derivatives
Investment grade risk exposure 350 346 1 year Corporate Credit A+ — —
Total [5] $ 4,487 $ 321 $ 2,029 $ 13
As of December 31, 2014 Unifying Referenced Credit
Obligation(s) [1]
Credit Derivative Type by Derivative Risk
Exposure Notional
Amount [2] Fair Value
Weighted
Average
Years to
Maturity Type
Average
Credit
Rating
Offsetting
Notional
Amount
[3]
Offsetting
Fair Value
[3]
Single name credit default swaps
Investment grade risk exposure $ 320 $ 5 2 years
Corporate Credit/
Foreign Gov. BBB+ $ 247 $ (5)
Below investment grade risk exposure 29 — 2 years Corporate Credit BB 29 (1)
Basket credit default swaps [4]
Investment grade risk exposure 2,546 33 3 years Corporate Credit BBB 1,973 (25)
Below investment grade risk exposure 38 (1) 12 years Corporate Credit D — —
Investment grade risk exposure 722 (12) 6 years CMBS Credit AA+ 269 3
Below investment grade risk exposure 154 (22) 2 years CMBS Credit CCC+ 154 23
Embedded credit derivatives
Investment grade risk exposure 350 342 2 years Corporate Credit A — —
Total [5] $ 4,159 $ 345 $ 2,672 $ (5)
[1] The average credit ratings are based on availability and the midpoint of the applicable ratings among Moody’s, S&P, Fitch and Morningstar. If
no rating is available from a rating agency, then an internally developed rating is used.
[2] Notional amount is equal to the maximum potential future loss amount. These derivatives are governed by agreements, clearing house rules and
applicable law which include collateral posting requirements. There is no additional specific collateral related to these contracts or recourse
provisions included in the contracts to offset losses.
[3] The Company has entered into offsetting credit default swaps to terminate certain existing credit default swaps, thereby offsetting the future
changes in value of, or losses paid related to, the original swap.
[4] Includes $3.9 billion and $3.5 billion as of December 31, 2015 and 2014, respectively, of notional amount on swaps of standard market indices of
diversified portfolios of corporate and CMBS issuers referenced through credit default swaps. These swaps are subsequently valued based upon
the observable standard market index.
[5] Excludes investments that contain an embedded credit derivative for which the Company has elected the fair value option. For further discussion,
see the Fair Value Option section in Note 4 - Fair Value Measurements.