The Hartford 2015 Annual Report Download - page 50
Download and view the complete annual report
Please find page 50 of the 2015 The Hartford annual report below. You can navigate through the pages in the report by either clicking on the pages listed below, or by using the keyword search tool below to find specific information within the annual report.-
 1
1 -
2
-
3
-
4
-
5
-
6
-
7
-
8
-
9
-
10
-
11
-
12
-
13
-
14
-
15
-
16
-
17
-
18
-
19
-
20
-
21
-
22
-
23
-
24
-
25
-
26
-
27
-
28
-
29
-
30
-
31
-
32
-
33
-
34
-
35
-
36
-
37
-
38
-
39
-
 40
40 -
 41
41 -
 42
42 -
 43
43 -
 44
44 -
 45
45 -
 46
46 -
 47
47 -
 48
48 -
 49
49 -
 50
50 -
 51
51 -
 52
52 -
 53
53 -
 54
54 -
 55
55 -
 56
56 -
 57
57 -
 58
58 -
 59
59 -
 60
60 -
61
-
62
-
63
-
64
-
65
-
66
-
67
-
68
-
69
-
70
-
71
-
72
-
73
-
74
-
75
-
76
-
77
-
78
-
79
-
80
-
81
-
82
-
83
-
84
-
85
-
86
-
87
-
88
-
89
-
90
-
91
-
92
-
93
-
94
-
95
-
96
-
97
-
98
-
99
-
100
-
101
-
102
-
103
-
104
-
105
-
106
-
107
-
108
-
109
-
110
-
111
-
112
-
113
-
114
-
115
-
116
-
117
-
118
-
119
-
120
-
121
-
122
-
123
-
124
-
125
-
126
-
127
-
128
-
129
-
130
-
131
-
132
-
133
-
134
-
135
-
136
-
137
-
138
-
139
-
140
-
141
-
142
-
143
-
144
-
145
-
146
-
147
-
148
-
149
-
150
-
151
-
152
-
153
-
154
-
155
-
156
-
157
-
158
-
159
-
160
-
161
-
162
-
163
-
164
-
165
-
166
-
167
-
168
-
169
-
170
-
171
-
172
-
173
-
174
-
175
-
176
-
177
-
178
-
179
-
180
-
181
-
182
-
183
-
184
-
185
-
186
-
187
-
188
-
189
-
190
-
191
-
192
-
193
-
194
-
195
-
196
-
197
-
198
-
199
-
200
-
201
-
202
-
203
-
204
-
205
-
206
-
207
-
208
-
209
-
210
-
211
-
212
-
213
-
214
-
215
-
216
-
217
-
218
-
219
-
220
-
221
-
222
-
223
-
224
-
225
-
226
-
227
-
228
-
229
-
230
-
231
-
232
-
233
-
234
-
235
-
236
-
237
-
238
-
239
-
240
-
241
-
242
-
243
-
244
-
245
-
246
-
247
-
248
-
249
-
250
-
251
-
252
-
253
-
254
-
255
 |
 |

50
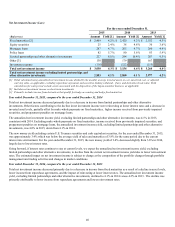
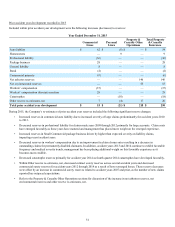
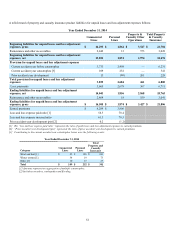
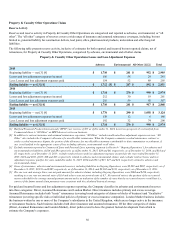
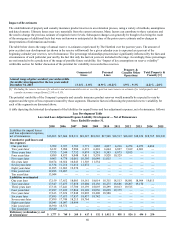
A roll-forward of property and casualty insurance product liabilities for unpaid losses and loss adjustment expenses follows:
Year Ended December 31, 2015
Commercial
Lines Personal
Lines
Property &
Casualty Other
Operations
Total Property
& Casualty
Insurance
Beginning liabilities for unpaid losses and loss adjustment
expenses, gross $ 16,465 $ 1,874 $ 3,467 $ 21,806
Reinsurance and other recoverables 2,459 18 564 3,041
Beginning liabilities for unpaid losses and loss adjustment
expenses, net 14,006 1,856 2,903 18,765
Provision for unpaid losses and loss adjustment expenses
Current accident year before catastrophes 3,712 2,578 25 6,315
Current accident year catastrophes [3] 121 211 — 332
Prior accident year development 53 (21) 218 250
Total provision for unpaid losses and loss adjustment
expenses 3,886 2,768 243 6,897
Less: payments 3,626 2,798 295 6,719
Ending liabilities for unpaid losses and loss adjustment
expenses, net 14,266 1,826 2,851 18,943
Reinsurance and other recoverables 2,293 19 570 2,882
Ending liabilities for unpaid losses and loss adjustment
expenses, gross $ 16,559 $ 1,845 $ 3,421 $ 21,825
Earned premiums $ 6,511 $ 3,873
Loss and loss expense paid ratio [1] 55.7 72.2
Loss and loss expense incurred ratio 59.7 71.5
Prior accident year development (pts) [2] 0.8 (0.5)
[1] The “loss and loss expense paid ratio” represents the ratio of paid losses and loss adjustment expenses to earned premiums.
[2] “Prior accident year development (pts)” represents the ratio of prior accident year development to earned premiums.
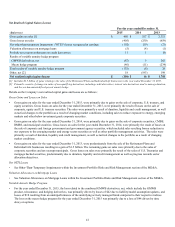
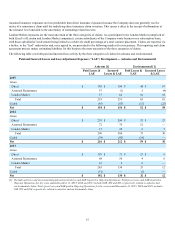
[3] Contributing to the current accident year catastrophes losses were the following events:
Year Ended December 31, 2015
Category Commercial
Lines Personal
Lines
Total
Property and
Casualty
Insurance
Wind and hail [1] $ 43 $ 114 $ 157
Winter storms [1] $ 57 $ 27 $ 84
Tornadoes [1] 18 29 47
Other [2] 3 41 44
Total $ 121 $ 211 $ 332
[1] These amounts represent an aggregation of multiple catastrophes.
[2] Consists primarily of wildfires.