The Hartford 2015 Annual Report Download - page 232
Download and view the complete annual report
Please find page 232 of the 2015 The Hartford annual report below. You can navigate through the pages in the report by either clicking on the pages listed below, or by using the keyword search tool below to find specific information within the annual report.-
 1
1 -
2
-
3
-
4
-
5
-
6
-
7
-
8
-
9
-
10
-
11
-
12
-
13
-
14
-
15
-
16
-
17
-
18
-
19
-
20
-
21
-
22
-
23
-
24
-
25
-
26
-
27
-
28
-
29
-
30
-
31
-
32
-
33
-
34
-
35
-
36
-
37
-
38
-
39
-
40
-
41
-
42
-
43
-
44
-
45
-
46
-
47
-
48
-
49
-
50
-
51
-
52
-
53
-
54
-
55
-
56
-
57
-
58
-
59
-
60
-
61
-
62
-
63
-
64
-
65
-
66
-
67
-
68
-
69
-
70
-
71
-
72
-
73
-
74
-
75
-
76
-
77
-
78
-
79
-
80
-
81
-
82
-
83
-
84
-
85
-
86
-
87
-
88
-
89
-
90
-
91
-
92
-
93
-
94
-
95
-
96
-
97
-
98
-
99
-
100
-
101
-
102
-
103
-
104
-
105
-
106
-
107
-
108
-
109
-
110
-
111
-
112
-
113
-
114
-
115
-
116
-
117
-
118
-
119
-
120
-
121
-
122
-
123
-
124
-
125
-
126
-
127
-
128
-
129
-
130
-
131
-
132
-
133
-
134
-
135
-
136
-
137
-
138
-
139
-
140
-
141
-
142
-
143
-
144
-
145
-
146
-
147
-
148
-
149
-
150
-
151
-
152
-
153
-
154
-
155
-
156
-
157
-
158
-
159
-
160
-
161
-
162
-
163
-
164
-
165
-
166
-
167
-
168
-
169
-
170
-
171
-
172
-
173
-
174
-
175
-
176
-
177
-
178
-
179
-
180
-
181
-
182
-
183
-
184
-
185
-
186
-
187
-
188
-
189
-
190
-
191
-
192
-
193
-
194
-
195
-
196
-
197
-
198
-
199
-
200
-
201
-
202
-
203
-
204
-
205
-
206
-
207
-
208
-
209
-
210
-
211
-
212
-
213
-
214
-
215
-
216
-
217
-
218
-
219
-
220
-
221
-
 222
222 -
 223
223 -
 224
224 -
 225
225 -
 226
226 -
 227
227 -
 228
228 -
 229
229 -
 230
230 -
 231
231 -
 232
232 -
 233
233 -
 234
234 -
 235
235 -
 236
236 -
 237
237 -
 238
238 -
 239
239 -
 240
240 -
 241
241 -
 242
242 -
243
-
244
-
245
-
246
-
247
-
248
-
249
-
250
-
251
-
252
-
253
-
254
-
255
 |
 |

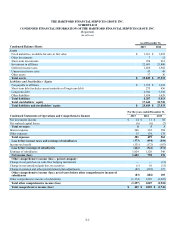
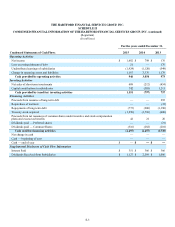
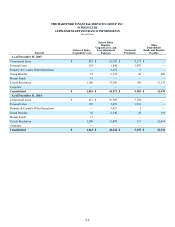
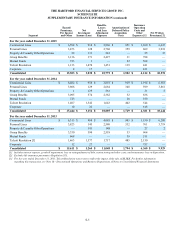
Table of Contents THE HARTFORD FINANCIAL SERVICES GROUP, INC.
NOTES TO CONSOLIDATED FINANCIAL STATEMENTS (continued)
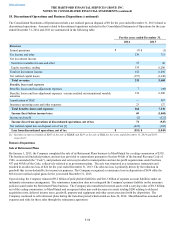
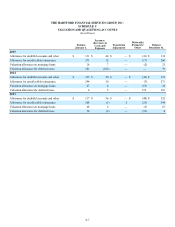
19. Restructuring and Other Costs (continued)
F-101
The tables below provide roll-forwards for accrued restructuring and other costs included in other liabilities in the Consolidated Balance
Sheets.
For the year ended December 31, 2015
Severance
Benefits and
Related Costs Professional
Fees Asset impairment
charges
Contract
Termination and
Other Charges Total Restructuring
and Other Costs
Balance, beginning of period $ 10 $ — $ — $ 6 $ 16
Accruals/provisions 6 — 17 (3) 20
Payments/write-offs (11) — (17)(3) (31)
Balance, end of period $ 5 $ — $ — $ — $ 5
For the year ended December 31, 2014
Severance
Benefits and
Related Costs Professional
Fees Asset impairment
charges
Contract
Termination and
Other Charges Total Restructuring
and Other Costs
Balance, beginning of period $ 22 $ — $ — $ 6 $ 28
Accruals/provisions 16 — 43 12 71
Payments/write-offs (28) — (43)(12) (83)
Balance, end of period $ 10 $ — $ — $ 6 $ 16
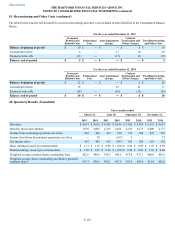
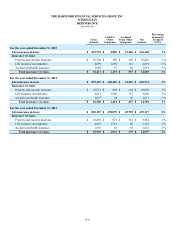
20. Quarterly Results (Unaudited)
Three months ended
March 31, June 30, September 30, December 31,
2015 2014 2015 2014 2015 2014 2015 2014
Revenues $ 4,617 $ 4,612 $ 4,685 $ 4,616 $ 4,562 $ 4,769 $ 4,513 $ 4,617
Benefits, losses and expenses 3,992 4,003 4,215 4,466 4,183 4,273 4,009 4,173
Income from continuing operations, net of tax 467 466 413 150 372 388 421 345
Income (loss) from discontinued operations, net of tax — 29 — (617) 9 — — 37
Net income (loss) 467 495 413 (467) 381 388 421 382
Basic earnings (losses) per common share $ 1.11 $ 1.10 $ 0.99 $ (1.04) $ 0.92 $ 0.89 $ 1.03 $ 0.89
Diluted earnings (losses) per common share $ 1.08 $ 1.03 $ 0.96 $ (1.00) $ 0.90 $ 0.86 $ 1.01 $ 0.86
Weighted average common shares outstanding, basic 422.6 449.8 418.7 450.6 413.8 437.2 406.9 429.6
Weighted average shares outstanding and dilutive potential
common shares 433.7 478.6 428.1 467.9 423.0 450.8 415.9 442.6