The Hartford 2015 Annual Report Download - page 115
Download and view the complete annual report
Please find page 115 of the 2015 The Hartford annual report below. You can navigate through the pages in the report by either clicking on the pages listed below, or by using the keyword search tool below to find specific information within the annual report.-
 1
1 -
2
-
3
-
4
-
5
-
6
-
7
-
8
-
9
-
10
-
11
-
12
-
13
-
14
-
15
-
16
-
17
-
18
-
19
-
20
-
21
-
22
-
23
-
24
-
25
-
26
-
27
-
28
-
29
-
30
-
31
-
32
-
33
-
34
-
35
-
36
-
37
-
38
-
39
-
40
-
41
-
42
-
43
-
44
-
45
-
46
-
47
-
48
-
49
-
50
-
51
-
52
-
53
-
54
-
55
-
56
-
57
-
58
-
59
-
60
-
61
-
62
-
63
-
64
-
65
-
66
-
67
-
68
-
69
-
70
-
71
-
72
-
73
-
74
-
75
-
76
-
77
-
78
-
79
-
80
-
81
-
82
-
83
-
84
-
85
-
86
-
87
-
88
-
89
-
90
-
91
-
92
-
93
-
94
-
95
-
96
-
97
-
98
-
99
-
100
-
101
-
102
-
103
-
104
-
 105
105 -
 106
106 -
 107
107 -
 108
108 -
 109
109 -
 110
110 -
 111
111 -
 112
112 -
 113
113 -
 114
114 -
 115
115 -
 116
116 -
 117
117 -
 118
118 -
 119
119 -
 120
120 -
 121
121 -
 122
122 -
 123
123 -
 124
124 -
 125
125 -
126
-
127
-
128
-
129
-
130
-
131
-
132
-
133
-
134
-
135
-
136
-
137
-
138
-
139
-
140
-
141
-
142
-
143
-
144
-
145
-
146
-
147
-
148
-
149
-
150
-
151
-
152
-
153
-
154
-
155
-
156
-
157
-
158
-
159
-
160
-
161
-
162
-
163
-
164
-
165
-
166
-
167
-
168
-
169
-
170
-
171
-
172
-
173
-
174
-
175
-
176
-
177
-
178
-
179
-
180
-
181
-
182
-
183
-
184
-
185
-
186
-
187
-
188
-
189
-
190
-
191
-
192
-
193
-
194
-
195
-
196
-
197
-
198
-
199
-
200
-
201
-
202
-
203
-
204
-
205
-
206
-
207
-
208
-
209
-
210
-
211
-
212
-
213
-
214
-
215
-
216
-
217
-
218
-
219
-
220
-
221
-
222
-
223
-
224
-
225
-
226
-
227
-
228
-
229
-
230
-
231
-
232
-
233
-
234
-
235
-
236
-
237
-
238
-
239
-
240
-
241
-
242
-
243
-
244
-
245
-
246
-
247
-
248
-
249
-
250
-
251
-
252
-
253
-
254
-
255
 |
 |

115
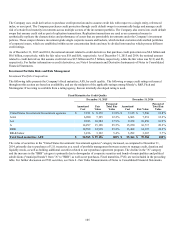
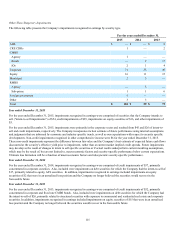
Other-Than-Temporary Impairments
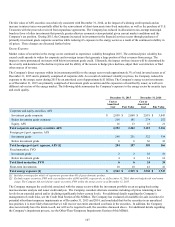
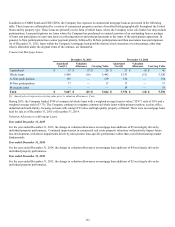
The following table presents the Company’s impairments recognized in earnings by security type.
For the years ended December 31,
2015 2014 2013
ABS $ — $ — $ 9
CRE CDOs 1 — 2
CMBS
Agency 1 — —
Bonds — 2 17
IOs 2 1 4
Corporate 71 35 20
Equity 16 11 15
Municipal 2 3 —
RMBS
Agency — 3 —
Sub-prime 1 1 6
Foreign government 5 — —
Other 3 3 —
Total $ 102 $ 59 $ 73
Year ended December 31, 2015
For the year ended December 31, 2015, impairments recognized in earnings were comprised of securities that the Company intends to
sell ("intent-to-sell impairments") of $54, credit impairments of $29, impairments on equity securities of $16, and other impairments of
$3.
For the year ended December 31, 2015, impairments were primarily in the corporate sector and resulted from $45 and $26 of intent-to-
sell and credit impairments, respectively. The Company incorporates its best estimate of future performance using internal assumptions
and judgments that are informed by economic and industry specific trends, as well as our expectations with respect to security specific
developments. Non-credit impairments recognized in other comprehensive income were $6 for the year ended December 31, 2015.
These non-credit impairments represent the difference between fair value and the Company’s best estimate of expected future cash flows
discounted at the security’s effective yield prior to impairment, rather than at current market implied credit spreads. Future impairments
may develop as the result of changes in intent to sell specific securities or if actual results underperform current modeling assumptions,
which may be the result of, but are not limited to, macroeconomic factors and security-specific performance below current expectations.
Ultimate loss formation will be a function of macroeconomic factors and idiosyncratic security-specific performance.
Year ended December 31, 2014
For the year ended December 31, 2014, impairments recognized in earnings were comprised of credit impairments of $37, primarily
concentrated in corporate securities. Also, included were impairments on debt securities for which the Company had the intent-to-sell of
$17, primarily related to equity, AFS securities. In addition, impairments recognized in earnings included impairments on equity
securities of $2 that were in an unrealized loss position and the Company no longer believed the securities would recover in the
foreseeable future.
Year ended December 31, 2013
For the year ended December 31, 2013, impairments recognized in earnings were comprised of credit impairments of $32, primarily
concentrated in corporate and fixed rate CMBS bonds. Also, included were impairments on debt securities for which the Company had
the intent-to-sell of $26, primarily related to structured securities with exposure to commercial and residential real estate and corporate
securities. In addition, impairments recognized in earnings included impairments on equity securities of $15 that were in an unrealized
loss position and the Company no longer believed the securities would recover in the foreseeable future.