The Hartford 2015 Annual Report Download - page 177
Download and view the complete annual report
Please find page 177 of the 2015 The Hartford annual report below. You can navigate through the pages in the report by either clicking on the pages listed below, or by using the keyword search tool below to find specific information within the annual report.-
 1
1 -
2
-
3
-
4
-
5
-
6
-
7
-
8
-
9
-
10
-
11
-
12
-
13
-
14
-
15
-
16
-
17
-
18
-
19
-
20
-
21
-
22
-
23
-
24
-
25
-
26
-
27
-
28
-
29
-
30
-
31
-
32
-
33
-
34
-
35
-
36
-
37
-
38
-
39
-
40
-
41
-
42
-
43
-
44
-
45
-
46
-
47
-
48
-
49
-
50
-
51
-
52
-
53
-
54
-
55
-
56
-
57
-
58
-
59
-
60
-
61
-
62
-
63
-
64
-
65
-
66
-
67
-
68
-
69
-
70
-
71
-
72
-
73
-
74
-
75
-
76
-
77
-
78
-
79
-
80
-
81
-
82
-
83
-
84
-
85
-
86
-
87
-
88
-
89
-
90
-
91
-
92
-
93
-
94
-
95
-
96
-
97
-
98
-
99
-
100
-
101
-
102
-
103
-
104
-
105
-
106
-
107
-
108
-
109
-
110
-
111
-
112
-
113
-
114
-
115
-
116
-
117
-
118
-
119
-
120
-
121
-
122
-
123
-
124
-
125
-
126
-
127
-
128
-
129
-
130
-
131
-
132
-
133
-
134
-
135
-
136
-
137
-
138
-
139
-
140
-
141
-
142
-
143
-
144
-
145
-
146
-
147
-
148
-
149
-
150
-
151
-
152
-
153
-
154
-
155
-
156
-
157
-
158
-
159
-
160
-
161
-
162
-
163
-
164
-
165
-
166
-
 167
167 -
 168
168 -
 169
169 -
 170
170 -
 171
171 -
 172
172 -
 173
173 -
 174
174 -
 175
175 -
 176
176 -
 177
177 -
 178
178 -
 179
179 -
 180
180 -
 181
181 -
 182
182 -
 183
183 -
 184
184 -
 185
185 -
 186
186 -
 187
187 -
188
-
189
-
190
-
191
-
192
-
193
-
194
-
195
-
196
-
197
-
198
-
199
-
200
-
201
-
202
-
203
-
204
-
205
-
206
-
207
-
208
-
209
-
210
-
211
-
212
-
213
-
214
-
215
-
216
-
217
-
218
-
219
-
220
-
221
-
222
-
223
-
224
-
225
-
226
-
227
-
228
-
229
-
230
-
231
-
232
-
233
-
234
-
235
-
236
-
237
-
238
-
239
-
240
-
241
-
242
-
243
-
244
-
245
-
246
-
247
-
248
-
249
-
250
-
251
-
252
-
253
-
254
-
255
 |
 |

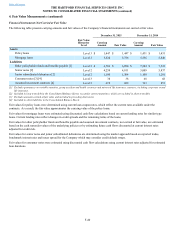
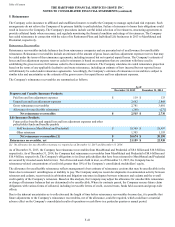
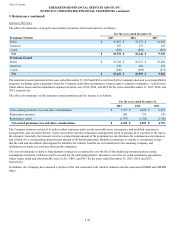
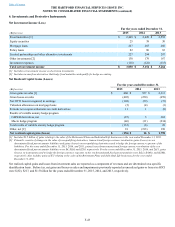
Table of Contents THE HARTFORD FINANCIAL SERVICES GROUP, INC.
NOTES TO CONSOLIDATED FINANCIAL STATEMENTS (continued)
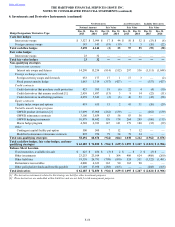
6. Investments and Derivative Instruments (continued)
F-46
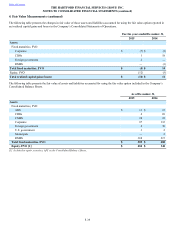
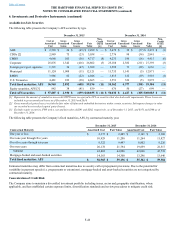
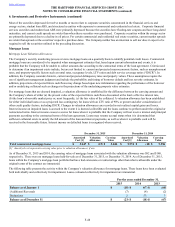
Available-for-Sale Securities
The following table presents the Company’s AFS securities by type.
December 31, 2015 December 31, 2014
Cost or
Amortized
Cost
Gross
Unrealized
Gains
Gross
Unrealized
Losses Fair
Value
Non-
Credit
OTTI
[1]
Cost or
Amortized
Cost
Gross
Unrealized
Gains
Gross
Unrealized
Losses Fair
Value
Non-
Credit
OTTI
[1]
ABS $ 2,520 $ 24 $ (45) $ 2,499 $ — $ 2,470 $ 39 $ (37) $ 2,472 $ (1)
CDOs [2] 2,989 75 (23) 3,038 — 2,776 98 (36) 2,841 —
CMBS 4,668 105 (56) 4,717 (8) 4,235 196 (16) 4,415 (6)
Corporate 25,876 1,342 (416) 26,802 (3) 25,188 2,382 (211) 27,359 (3)
Foreign govt./govt. agencies 1,321 34 (47) 1,308 — 1,592 73 (29) 1,636 —
Municipal 11,124 1,008 (11) 12,121 — 11,735 1,141 (5) 12,871 —
RMBS 3,986 82 (22) 4,046 — 3,815 122 (19) 3,918 (1)
U.S. Treasuries 4,481 222 (38) 4,665 — 3,551 326 (5) 3,872 —
Total fixed maturities, AFS 56,965 2,892 (658) 59,196 (11) 55,362 4,377 (358) 59,384 (11)
Equity securities, AFS [3] 842 38 (41) 839 — 676 50 (27) 699 —
Total AFS securities $ 57,807 $ 2,930 $ (699) $ 60,035 $ (11) $ 56,038 $ 4,427 $ (385) $60,083 $ (11)
[1] Represents the amount of cumulative non-credit OTTI losses recognized in OCI on securities that also had credit impairments. These losses are
included in gross unrealized losses as of December 31, 2015 and 2014.
[2] Gross unrealized gains (losses) exclude the fair value of bifurcated embedded derivatives within certain securities. Subsequent changes in value
are recorded in net realized capital gains (losses).
[3] Excludes equity securities, FVO with a cost and fair value of $293 and $282, respectively, as of December 31, 2015, and $351 and $348 as of
December 31, 2014.
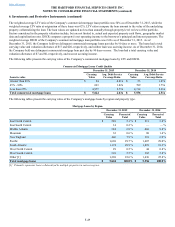
The following table presents the Company’s fixed maturities, AFS, by contractual maturity year.
December 31, 2015 December 31, 2014
Contractual Maturity Amortized Cost Fair Value Amortized Cost Fair Value
One year or less $ 2,373 $ 2,405 $ 2,141 $ 2,168
Over one year through five years 10,929 11,200 11,264 11,827
Over five years through ten years 9,322 9,497 8,802 9,226
Over ten years 20,178 21,794 19,859 22,517
Subtotal 42,802 44,896 42,066 45,738
Mortgage-backed and asset-backed securities 14,163 14,300 13,296 13,646
Total fixed maturities, AFS $ 56,965 $ 59,196 $ 55,362 $ 59,384
Estimated maturities may differ from contractual maturities due to security call or prepayment provisions. Due to the potential for
variability in payment speeds (i.e. prepayments or extensions), mortgage-backed and asset-backed securities are not categorized by
contractual maturity.
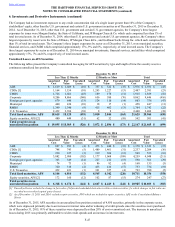
Concentration of Credit Risk
The Company aims to maintain a diversified investment portfolio including issuer, sector and geographic stratification, where
applicable, and has established certain exposure limits, diversification standards and review procedures to mitigate credit risk.