The Hartford 2015 Annual Report Download - page 186
Download and view the complete annual report
Please find page 186 of the 2015 The Hartford annual report below. You can navigate through the pages in the report by either clicking on the pages listed below, or by using the keyword search tool below to find specific information within the annual report.-
 1
1 -
2
-
3
-
4
-
5
-
6
-
7
-
8
-
9
-
10
-
11
-
12
-
13
-
14
-
15
-
16
-
17
-
18
-
19
-
20
-
21
-
22
-
23
-
24
-
25
-
26
-
27
-
28
-
29
-
30
-
31
-
32
-
33
-
34
-
35
-
36
-
37
-
38
-
39
-
40
-
41
-
42
-
43
-
44
-
45
-
46
-
47
-
48
-
49
-
50
-
51
-
52
-
53
-
54
-
55
-
56
-
57
-
58
-
59
-
60
-
61
-
62
-
63
-
64
-
65
-
66
-
67
-
68
-
69
-
70
-
71
-
72
-
73
-
74
-
75
-
76
-
77
-
78
-
79
-
80
-
81
-
82
-
83
-
84
-
85
-
86
-
87
-
88
-
89
-
90
-
91
-
92
-
93
-
94
-
95
-
96
-
97
-
98
-
99
-
100
-
101
-
102
-
103
-
104
-
105
-
106
-
107
-
108
-
109
-
110
-
111
-
112
-
113
-
114
-
115
-
116
-
117
-
118
-
119
-
120
-
121
-
122
-
123
-
124
-
125
-
126
-
127
-
128
-
129
-
130
-
131
-
132
-
133
-
134
-
135
-
136
-
137
-
138
-
139
-
140
-
141
-
142
-
143
-
144
-
145
-
146
-
147
-
148
-
149
-
150
-
151
-
152
-
153
-
154
-
155
-
156
-
157
-
158
-
159
-
160
-
161
-
162
-
163
-
164
-
165
-
166
-
167
-
168
-
169
-
170
-
171
-
172
-
173
-
174
-
175
-
 176
176 -
 177
177 -
 178
178 -
 179
179 -
 180
180 -
 181
181 -
 182
182 -
 183
183 -
 184
184 -
 185
185 -
 186
186 -
 187
187 -
 188
188 -
 189
189 -
 190
190 -
 191
191 -
 192
192 -
 193
193 -
 194
194 -
 195
195 -
 196
196 -
197
-
198
-
199
-
200
-
201
-
202
-
203
-
204
-
205
-
206
-
207
-
208
-
209
-
210
-
211
-
212
-
213
-
214
-
215
-
216
-
217
-
218
-
219
-
220
-
221
-
222
-
223
-
224
-
225
-
226
-
227
-
228
-
229
-
230
-
231
-
232
-
233
-
234
-
235
-
236
-
237
-
238
-
239
-
240
-
241
-
242
-
243
-
244
-
245
-
246
-
247
-
248
-
249
-
250
-
251
-
252
-
253
-
254
-
255
 |
 |

Table of Contents THE HARTFORD FINANCIAL SERVICES GROUP, INC.
NOTES TO CONSOLIDATED FINANCIAL STATEMENTS (continued)
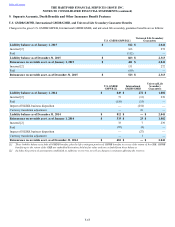
6. Investments and Derivative Instruments (continued)
F-55
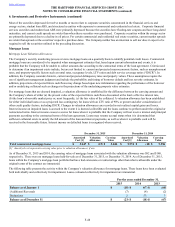
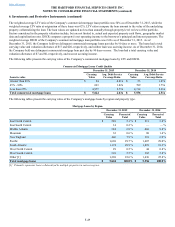
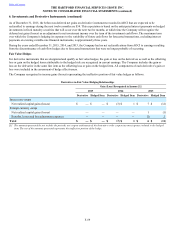
The Company utilizes derivatives (“GMWB hedging instruments”) as part of an actively managed program designed to hedge a portion
of the capital market risk exposures of the non-reinsured GMWB riders due to changes in interest rates, equity market levels, and equity
volatility. These derivatives include customized swaps, interest rate swaps and futures, and equity swaps, options and futures, on certain
indices including the S&P 500 index, EAFE index and NASDAQ index. The following table presents notional and fair value for GMWB
hedging instruments.
Notional Amount Fair Value
December 31,
2015 December 31,
2014 December 31,
2015 December 31,
2014
Customized swaps $ 5,877 $ 7,041 $ 131 $ 124
Equity swaps, options, and futures 1,362 3,761 2 39
Interest rate swaps and futures 3,740 3,640 25 11
Total $ 10,979 $ 14,442 $ 158 $ 174
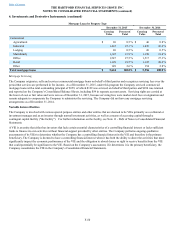
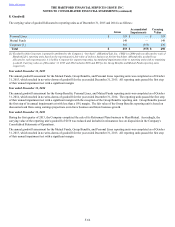
Macro Hedge Program
The Company utilizes equity options, swaps, futures, and foreign currency options to partially hedge against a decline in the equity
markets and the resulting statutory surplus and capital impact primarily arising from the guaranteed minimum death benefit ("GMDB")
and GMWB obligations. The following table presents notional and fair value for the macro hedge program.
Notional Amount Fair Value
December 31,
2015 December 31,
2014 December 31,
2015 December 31,
2014
Equity swaps, options, and futures $ 4,548 $ 5,983 $ 147 $ 141
Foreign currency options — 400 — —
Total $ 4,548 $ 6,383 $ 147 $ 141
Contingent Capital Facility Put Option
The Company entered into a put option agreement that provides the Company the right to require a third-party trust to purchase, at any
time, The Hartford’s junior subordinated notes in a maximum aggregate principal amount of $500. Under the put option agreement, The
Hartford will pay premiums on a periodic basis and will reimburse the trust for certain fees and ordinary expenses.
Modified Coinsurance Reinsurance Contracts
As of December 31, 2015 and 2014, the Company had approximately $895 and $1.0 billion, respectively, of invested assets supporting
other policyholder funds and benefits payable reinsured under a modified coinsurance arrangement in connection with the sale of the
Individual Life business, which was structured as a reinsurance transaction. The assets are primarily held in a trust established by the
Company. The Company pays or receives cash quarterly to settle the results of the reinsured business, including the investment results.
As a result of this modified coinsurance arrangement, the Company has an embedded derivative that transfers to the reinsurer certain
unrealized changes in fair value due to interest rate and credit risks of these assets. The notional amount of the embedded derivative
reinsurance contracts are the invested assets that are carried at fair value supporting the reinsured reserves.
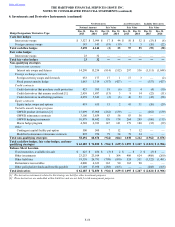
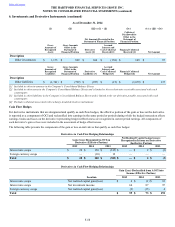
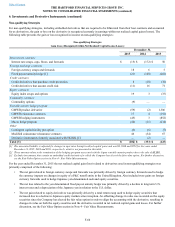
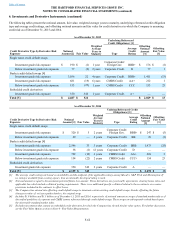
Derivative Balance Sheet Classification
The following table summarizes the balance sheet classification of the Company’s derivative related net fair value amounts as well as the
gross asset and liability fair value amounts. For reporting purposes, the Company has elected to offset within total assets or total
liabilities based upon the net of the fair value amounts, income accruals, and related cash collateral receivables and payables of OTC
derivative instruments executed in a legal entity and with the same counterparty under a master netting agreement, which provides the
Company with the legal right of offset. The Company has also elected to offset within total assets or total liabilities based upon the net of
the fair value amounts, income accruals and related cash collateral receivables and payables of OTC-cleared derivative instruments
based on clearing house agreements. The following fair value amounts do not include income accruals or related cash collateral
receivables and payables, which are netted with derivative fair value amounts to determine balance sheet presentation. Derivative fair
value reported as liabilities after taking into account the master netting agreements was $1.1 billion as of December 31, 2015 and 2014.
Derivatives in the Company’s separate accounts, where the associated gains and losses accrue directly to policyholders, are not included
in the table below. The Company’s derivative instruments are held for risk management purposes, unless otherwise noted in the
following table. The notional amount of derivative contracts represents the basis upon which pay or receive amounts are calculated and
is presented in the table to quantify the volume of the Company’s derivative activity. Notional amounts are not necessarily reflective of
credit risk. The following tables exclude investments that contain an embedded credit derivative for which the Company has elected the
fair value option. For further discussion, see the Fair Value Option section in Note 4 - Fair Value Measurements of Notes to the
Consolidated Financial Statements.