The Hartford 2015 Annual Report Download - page 157
Download and view the complete annual report
Please find page 157 of the 2015 The Hartford annual report below. You can navigate through the pages in the report by either clicking on the pages listed below, or by using the keyword search tool below to find specific information within the annual report.-
 1
1 -
2
-
3
-
4
-
5
-
6
-
7
-
8
-
9
-
10
-
11
-
12
-
13
-
14
-
15
-
16
-
17
-
18
-
19
-
20
-
21
-
22
-
23
-
24
-
25
-
26
-
27
-
28
-
29
-
30
-
31
-
32
-
33
-
34
-
35
-
36
-
37
-
38
-
39
-
40
-
41
-
42
-
43
-
44
-
45
-
46
-
47
-
48
-
49
-
50
-
51
-
52
-
53
-
54
-
55
-
56
-
57
-
58
-
59
-
60
-
61
-
62
-
63
-
64
-
65
-
66
-
67
-
68
-
69
-
70
-
71
-
72
-
73
-
74
-
75
-
76
-
77
-
78
-
79
-
80
-
81
-
82
-
83
-
84
-
85
-
86
-
87
-
88
-
89
-
90
-
91
-
92
-
93
-
94
-
95
-
96
-
97
-
98
-
99
-
100
-
101
-
102
-
103
-
104
-
105
-
106
-
107
-
108
-
109
-
110
-
111
-
112
-
113
-
114
-
115
-
116
-
117
-
118
-
119
-
120
-
121
-
122
-
123
-
124
-
125
-
126
-
127
-
128
-
129
-
130
-
131
-
132
-
133
-
134
-
135
-
136
-
137
-
138
-
139
-
140
-
141
-
142
-
143
-
144
-
145
-
146
-
 147
147 -
 148
148 -
 149
149 -
 150
150 -
 151
151 -
 152
152 -
 153
153 -
 154
154 -
 155
155 -
 156
156 -
 157
157 -
 158
158 -
 159
159 -
 160
160 -
 161
161 -
 162
162 -
 163
163 -
 164
164 -
 165
165 -
 166
166 -
 167
167 -
168
-
169
-
170
-
171
-
172
-
173
-
174
-
175
-
176
-
177
-
178
-
179
-
180
-
181
-
182
-
183
-
184
-
185
-
186
-
187
-
188
-
189
-
190
-
191
-
192
-
193
-
194
-
195
-
196
-
197
-
198
-
199
-
200
-
201
-
202
-
203
-
204
-
205
-
206
-
207
-
208
-
209
-
210
-
211
-
212
-
213
-
214
-
215
-
216
-
217
-
218
-
219
-
220
-
221
-
222
-
223
-
224
-
225
-
226
-
227
-
228
-
229
-
230
-
231
-
232
-
233
-
234
-
235
-
236
-
237
-
238
-
239
-
240
-
241
-
242
-
243
-
244
-
245
-
246
-
247
-
248
-
249
-
250
-
251
-
252
-
253
-
254
-
255
 |
 |

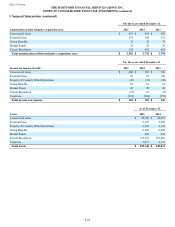
Table of Contents THE HARTFORD FINANCIAL SERVICES GROUP, INC.
NOTES TO CONSOLIDATED FINANCIAL STATEMENTS (continued)
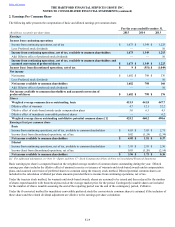
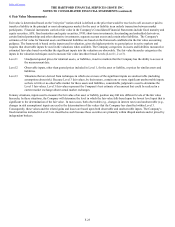
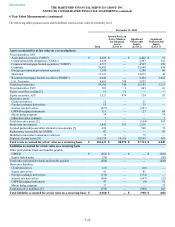
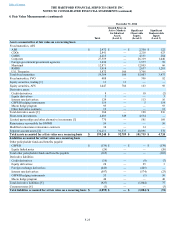
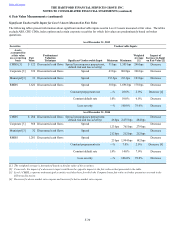
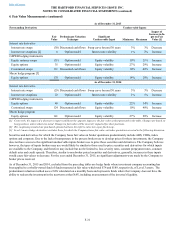
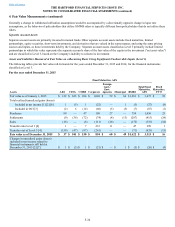
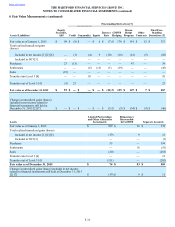
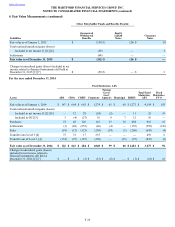
4. Fair Value Measurements (continued)
F-26
[1] Included in other investments on the Consolidated Balance Sheets.
[2] Includes OTC and OTC-cleared derivative instruments in a net positive fair value position after consideration of the accrued interest and impact
of collateral posting requirements which may be imposed by agreements, clearing house rules and applicable law. As of December 31, 2015 and
2014, $283 and $413, respectively, of cash collateral liability was netted against the derivative asset value in the Consolidated Balance Sheets and
is excluded from the preceding table. See footnote 5 for derivative liabilities.
[3] Represents hedge funds where investment company accounting has been applied to a wholly-owned fund of funds measured at fair value.
[4] Approximately $1.8 billion and $2.5 billion of investment sales receivable, as of December 31, 2015 and 2014, respectively, are excluded from this
disclosure requirement because they are trade receivables in the ordinary course of business where the carrying amount approximates fair value.
[5] Includes OTC and OTC-cleared derivative instruments in a net negative fair market value position (derivative liability) after consideration of the
accrued interest and impact of collateral posting requirements which may be imposed by agreements, clearing house rules and applicable law. In
the following Level 3 roll-forward table in this Note 4, the derivative assets and liabilities are referred to as “freestanding derivatives” and are
presented on a net basis.
[6] Represents embedded derivatives associated with non-funding agreement-backed consumer equity linked notes.
Valuation Techniques, Procedures and Controls
The Company determines the fair values of certain financial assets and liabilities based on quoted market prices where available, and
where prices represent a reasonable estimate of fair value. The Company also determines fair value based on future cash flows
discounted at the appropriate current market rate. Fair values reflect adjustments for counterparty credit quality, the Company’s default
spreads, liquidity, and where appropriate, risk margins on unobservable parameters.
The fair value process is monitored by the Valuation Committee, which is a cross-functional group of senior management within the
Company that meets at least quarterly. The Valuation Committee is co-chaired by the Heads of Investment Operations and Accounting,
and has representation from various investment sector professionals, accounting, operations, legal, compliance, and risk management.
The purpose of the committee is to oversee the pricing policy and procedures by ensuring objective and reliable valuation practices and
pricing of financial instruments, as well as addressing valuation issues and approving changes to valuation methodologies and pricing
sources. There are also two working groups under the Valuation Committee, a Securities Fair Value Working Group (“Securities
Working Group”) and a Derivatives Fair Value Working Group ("Derivatives Working Group"), which include various investment,
operations, accounting and risk management professionals that meet monthly to review market data trends, pricing and trading statistics
and results, and any proposed pricing methodology changes.
The Company also has an enterprise-wide Operational Risk Management function, led by the Chief Operational Risk Officer, which is
responsible for establishing, maintaining and communicating the framework, principles and guidelines of the Company's operational risk
management program. This includes model risk management which provides an independent review of the suitability, characteristics
and reliability of model inputs, as well as an analysis of significant changes to current models.
Fixed Maturities, Equity Securities and Short-term Investments
The fair value of fixed maturities, equity securities, and short-term investments in an active and orderly market (e.g., not distressed or
forced liquidation) are determined by management using a "waterfall" approach after considering the following pricing sources: quoted
prices for identical assets or liabilities, prices from third-party pricing services, independent broker quotations, or internal matrix pricing
processes. Typical inputs used by these pricing sources include, but are not limited to, benchmark yields, reported trades, broker/dealer
quotes, issuer spreads, benchmark securities, bids, offers, and/or estimated cash flows, prepayment speeds, and default rates. Most fixed
maturities do not trade daily. Based on the typical trading volumes and the lack of quoted market prices for fixed maturities, third-party
pricing services utilize matrix pricing to derive security prices. Matrix pricing relies on securities' relationships to other benchmark
quoted securities, which trade more frequently. Pricing services utilize recently reported trades of identical or similar securities making
adjustments through the reporting date based on the preceding outlined available market observable information. If there are no recently
reported trades, the third-party pricing services may develop a security price using expected future cash flows based upon collateral
performance and discounted at an estimated market rate. Both matrix pricing and discounted cash flow techniques develop prices by
factoring in the time value for cash flows and risk, including liquidity and credit.
Prices from third-party pricing services may be unavailable for securities that are rarely traded or are traded only in privately negotiated
transactions. As a result, certain securities are priced via independent broker quotations which utilize inputs that may be difficult to
corroborate with observable market based data. Additionally, the majority of these independent broker quotations are non-binding.
The Company utilizes an internally developed matrix pricing process for private placement securities for which the Company is unable
to obtain a price from a third-party pricing service. The Company's process is similar to the third-party pricing services. The Company
develops credit spreads each month using market based data for public securities adjusted for credit spread differentials between public
and private securities which are obtained from a survey of multiple private placement brokers. The credit spreads determined through
this survey approach are based upon the issuer’s financial strength and term to maturity, utilizing independent public security index and
trade information and adjusting for the non-public nature of the securities. Credit spreads combined with risk-free rates are applied to
contractual cash flows to develop a price.