The Hartford 2015 Annual Report Download - page 114
Download and view the complete annual report
Please find page 114 of the 2015 The Hartford annual report below. You can navigate through the pages in the report by either clicking on the pages listed below, or by using the keyword search tool below to find specific information within the annual report.-
 1
1 -
2
-
3
-
4
-
5
-
6
-
7
-
8
-
9
-
10
-
11
-
12
-
13
-
14
-
15
-
16
-
17
-
18
-
19
-
20
-
21
-
22
-
23
-
24
-
25
-
26
-
27
-
28
-
29
-
30
-
31
-
32
-
33
-
34
-
35
-
36
-
37
-
38
-
39
-
40
-
41
-
42
-
43
-
44
-
45
-
46
-
47
-
48
-
49
-
50
-
51
-
52
-
53
-
54
-
55
-
56
-
57
-
58
-
59
-
60
-
61
-
62
-
63
-
64
-
65
-
66
-
67
-
68
-
69
-
70
-
71
-
72
-
73
-
74
-
75
-
76
-
77
-
78
-
79
-
80
-
81
-
82
-
83
-
84
-
85
-
86
-
87
-
88
-
89
-
90
-
91
-
92
-
93
-
94
-
95
-
96
-
97
-
98
-
99
-
100
-
101
-
102
-
103
-
 104
104 -
 105
105 -
 106
106 -
 107
107 -
 108
108 -
 109
109 -
 110
110 -
 111
111 -
 112
112 -
 113
113 -
 114
114 -
 115
115 -
 116
116 -
 117
117 -
 118
118 -
 119
119 -
 120
120 -
 121
121 -
 122
122 -
 123
123 -
 124
124 -
125
-
126
-
127
-
128
-
129
-
130
-
131
-
132
-
133
-
134
-
135
-
136
-
137
-
138
-
139
-
140
-
141
-
142
-
143
-
144
-
145
-
146
-
147
-
148
-
149
-
150
-
151
-
152
-
153
-
154
-
155
-
156
-
157
-
158
-
159
-
160
-
161
-
162
-
163
-
164
-
165
-
166
-
167
-
168
-
169
-
170
-
171
-
172
-
173
-
174
-
175
-
176
-
177
-
178
-
179
-
180
-
181
-
182
-
183
-
184
-
185
-
186
-
187
-
188
-
189
-
190
-
191
-
192
-
193
-
194
-
195
-
196
-
197
-
198
-
199
-
200
-
201
-
202
-
203
-
204
-
205
-
206
-
207
-
208
-
209
-
210
-
211
-
212
-
213
-
214
-
215
-
216
-
217
-
218
-
219
-
220
-
221
-
222
-
223
-
224
-
225
-
226
-
227
-
228
-
229
-
230
-
231
-
232
-
233
-
234
-
235
-
236
-
237
-
238
-
239
-
240
-
241
-
242
-
243
-
244
-
245
-
246
-
247
-
248
-
249
-
250
-
251
-
252
-
253
-
254
-
255
 |
 |

114
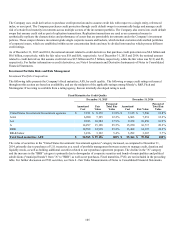
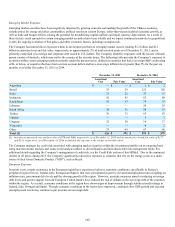
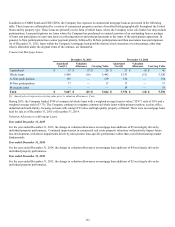
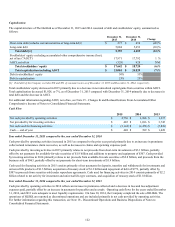
Available-for-Sale Securities — Unrealized Loss Aging
The total gross unrealized losses were $699 as of December 31, 2015, and have increased $314, or 82%, from December 31, 2014, due
to wider credit spreads and higher interest rates. As of December 31, 2015, $582 of the gross unrealized losses were associated with
securities depressed less than 20% of cost or amortized cost. The remaining $117 of gross unrealized losses were associated with
securities depressed greater than 20%. The securities depressed more than 20% are primarily corporate securities that decreased in value
due to widening of the sector credit spreads and an increase in interest rates.
As part of the Company’s ongoing security monitoring process, the Company has reviewed its AFS securities in an unrealized loss
position and concluded that these securities are temporarily depressed and are expected to recover in value as the securities approach
maturity or as market spreads tighten. For these securities in an unrealized loss position where a credit impairment has not been
recorded, the Company’s best estimate of expected future cash flows are sufficient to recover the amortized cost basis of the security.
Furthermore, the Company neither has an intention to sell nor does it expect to be required to sell these securities. For further
information regarding the Company’s impairment analysis, see Other-Than-Temporary Impairments in the Investment Portfolio Risks
and Risk Management section of this MD&A.
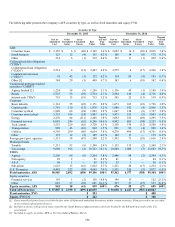
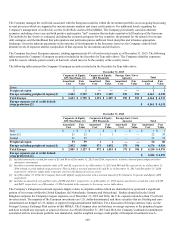
The following tables present the Company’s unrealized loss aging for AFS securities by length of time the security was in a continuous
unrealized loss position:
December 31, 2015 December 31, 2014
Consecutive Months Items
Cost or
Amortized
Cost Fair
Value Unrealized
Loss [1] Items
Cost or
Amortized
Cost Fair
Value Unrealized
Loss [1]
Three months or less 2,094 $ 10,535 $10,398 $ (137) 1,412 $ 4,014 $ 3,963 $ (51)
Greater than three to six months 819 2,837 2,735 (102) 643 1,739 1,665 (74)
Greater than six to nine months 933 4,421 4,194 (227) 220 417 404 (13)
Greater than nine to eleven months 329 1,302 1,242 (60) 102 148 142 (6)
Twelve months or more 675 3,072 2,896 (173) 688 4,667 4,429 (241)
Total 4,850 $ 22,167 $21,465 $ (699) 3,065 $ 10,985 $ 10,603 $ (385)
[1] Unrealized losses exclude the fair value of bifurcated embedded derivative features of certain securities as changes in value are recorded in net
realized capital gains (losses).
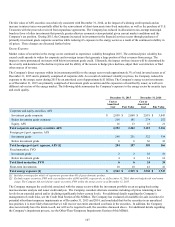
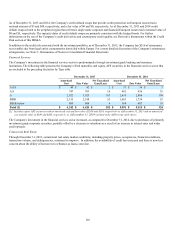
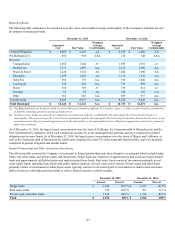
The following table presents the Company’s unrealized loss aging for AFS securities continuously depressed over 20% by length of time
(included in the preceding table):
December 31, 2015 December 31, 2014
Consecutive Months Items
Cost or
Amortized
Cost Fair
Value Unrealized
Loss [1] Items
Cost or
Amortized
Cost Fair
Value Unrealized
Loss [1]
Three months or less 240 $ 288 $ 212 $ (76) 137 $ 152 $ 113 $ (39)
Greater than three to six months 130 77 51 (26) 39 17 11 (6)
Greater than six to nine months 5 3 2 (1) 11 4 1 (3)
Greater than nine to eleven months 6 12 8 (4) 9 1 — (1)
Twelve months or more 50 28 18 (10) 49 31 19 (12)
Total 431 $ 408 $ 291 $ (117) 245 $ 205 $ 144 $ (61)
[1] Unrealized losses exclude the fair value of bifurcated embedded derivatives features of certain securities as changes in value are recorded in net
realized capital gains (losses).