The Hartford 2015 Annual Report Download - page 80
Download and view the complete annual report
Please find page 80 of the 2015 The Hartford annual report below. You can navigate through the pages in the report by either clicking on the pages listed below, or by using the keyword search tool below to find specific information within the annual report.-
 1
1 -
2
-
3
-
4
-
5
-
6
-
7
-
8
-
9
-
10
-
11
-
12
-
13
-
14
-
15
-
16
-
17
-
18
-
19
-
20
-
21
-
22
-
23
-
24
-
25
-
26
-
27
-
28
-
29
-
30
-
31
-
32
-
33
-
34
-
35
-
36
-
37
-
38
-
39
-
40
-
41
-
42
-
43
-
44
-
45
-
46
-
47
-
48
-
49
-
50
-
51
-
52
-
53
-
54
-
55
-
56
-
57
-
58
-
59
-
60
-
61
-
62
-
63
-
64
-
65
-
66
-
67
-
68
-
69
-
 70
70 -
 71
71 -
 72
72 -
 73
73 -
 74
74 -
 75
75 -
 76
76 -
 77
77 -
 78
78 -
 79
79 -
 80
80 -
 81
81 -
 82
82 -
 83
83 -
 84
84 -
 85
85 -
 86
86 -
 87
87 -
 88
88 -
 89
89 -
 90
90 -
91
-
92
-
93
-
94
-
95
-
96
-
97
-
98
-
99
-
100
-
101
-
102
-
103
-
104
-
105
-
106
-
107
-
108
-
109
-
110
-
111
-
112
-
113
-
114
-
115
-
116
-
117
-
118
-
119
-
120
-
121
-
122
-
123
-
124
-
125
-
126
-
127
-
128
-
129
-
130
-
131
-
132
-
133
-
134
-
135
-
136
-
137
-
138
-
139
-
140
-
141
-
142
-
143
-
144
-
145
-
146
-
147
-
148
-
149
-
150
-
151
-
152
-
153
-
154
-
155
-
156
-
157
-
158
-
159
-
160
-
161
-
162
-
163
-
164
-
165
-
166
-
167
-
168
-
169
-
170
-
171
-
172
-
173
-
174
-
175
-
176
-
177
-
178
-
179
-
180
-
181
-
182
-
183
-
184
-
185
-
186
-
187
-
188
-
189
-
190
-
191
-
192
-
193
-
194
-
195
-
196
-
197
-
198
-
199
-
200
-
201
-
202
-
203
-
204
-
205
-
206
-
207
-
208
-
209
-
210
-
211
-
212
-
213
-
214
-
215
-
216
-
217
-
218
-
219
-
220
-
221
-
222
-
223
-
224
-
225
-
226
-
227
-
228
-
229
-
230
-
231
-
232
-
233
-
234
-
235
-
236
-
237
-
238
-
239
-
240
-
241
-
242
-
243
-
244
-
245
-
246
-
247
-
248
-
249
-
250
-
251
-
252
-
253
-
254
-
255
 |
 |

80
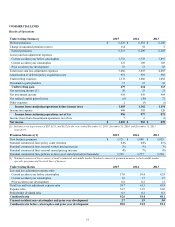
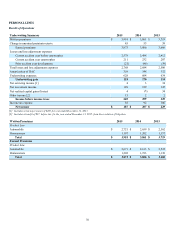
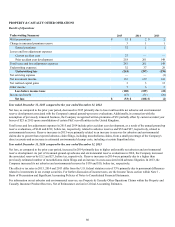
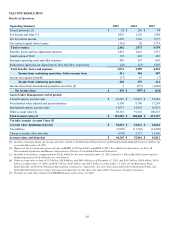
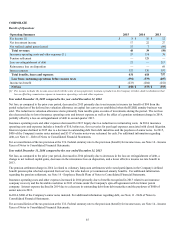
PROPERTY & CASUALTY OTHER OPERATIONS
Results of Operations
Underwriting Summary 2015 2014 2013
Written premiums $ 35 $ 2 $ 2
Change in unearned premium reserve 3 1 1
Earned premiums 32 1 1
Losses and loss adjustment expenses
Current accident year 25 — —
Prior accident year development 218 261 148
Total losses and loss adjustment expenses 243 261 148
Underwriting expenses 32 37 29
Underwriting loss (243)(297) (176)
Net servicing expense — — (1)
Net investment income 133 129 141
Net realized capital gains 3 3 12
Other income 7 6 2
Loss before income taxes (100)(159) (22)
Income tax benefit (47)(51) (20)
Net loss $ (53) $ (108) $ (2)
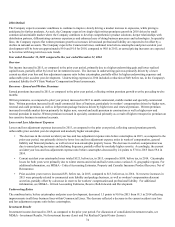
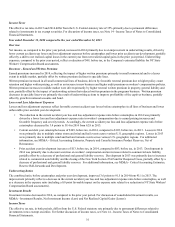
Year ended December 31, 2015 compared to the year ended December 31, 2014
Net loss, as compared to the prior year period, decreased in 2015 primarily due to lower unfavorable net asbestos and environmental
reserve development associated with the Company's annual ground-up reserve evaluations. Additionally, in connection with the
assumption of previously reinsured business, the Company recognized written premiums of $31 partially offset by current accident year
losses of $25 in 2015 upon consolidation of certain P&C run-off entities in the United Kingdom.
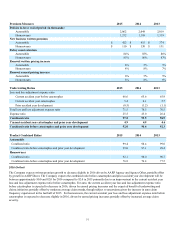
Total losses and loss adjustment expenses in 2015 and 2014 include prior accident year development, as a result of the annual ground-up
reserve evaluations, of $146 and $212, before tax, respectively, related to asbestos reserves and $52 and $27, respectively, related to
environmental reserves. Reserve increases in 2015 were primarily related to an increase in reserves for asbestos and environmental
claims due to greater than expected asbestos claim filings, including mesothelioma claims, from a small percentage of the Company's
direct accounts and an increase in estimated environmental cleanup costs, including at certain Superfund sites.
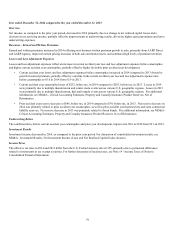
Year ended December 31, 2014 compared to the year ended December 31, 2013
Net loss, as compared to the prior year period, increased in 2014 primarily due to higher unfavorable net asbestos and environmental
reserve development. As part of its annual ground-up asbestos and environmental reserve evaluations in 2014, the Company increased
the associated reserves by $212 and $27, before tax, respectively. Reserve increases in 2014 were primarily due to a higher than
previously estimated number of mesothelioma claim filings and an increase in costs associated with asbestos litigation. In 2013, the
Company increased its net asbestos and environmental reserves by $130 and $10, before tax, respectively.
The effective tax rates in 2015, 2014 and 2013 differ from the U.S. federal statutory rate of 35% primarily due to permanent differences
related to investments in tax exempt securities. For further discussion of income taxes, see the Income Taxes section within Note 1 -
Basis of Presentation and Significant Accounting Policies of Notes to Consolidated Financial Statements.
For information on net asbestos and environmental reserves, see Property & Casualty Other Operations Claims within the Property and
Casualty Insurance Product Reserves, Net of Reinsurance section in Critical Accounting Estimates.