The Hartford 2015 Annual Report Download - page 106
Download and view the complete annual report
Please find page 106 of the 2015 The Hartford annual report below. You can navigate through the pages in the report by either clicking on the pages listed below, or by using the keyword search tool below to find specific information within the annual report.-
 1
1 -
2
-
3
-
4
-
5
-
6
-
7
-
8
-
9
-
10
-
11
-
12
-
13
-
14
-
15
-
16
-
17
-
18
-
19
-
20
-
21
-
22
-
23
-
24
-
25
-
26
-
27
-
28
-
29
-
30
-
31
-
32
-
33
-
34
-
35
-
36
-
37
-
38
-
39
-
40
-
41
-
42
-
43
-
44
-
45
-
46
-
47
-
48
-
49
-
50
-
51
-
52
-
53
-
54
-
55
-
56
-
57
-
58
-
59
-
60
-
61
-
62
-
63
-
64
-
65
-
66
-
67
-
68
-
69
-
70
-
71
-
72
-
73
-
74
-
75
-
76
-
77
-
78
-
79
-
80
-
81
-
82
-
83
-
84
-
85
-
86
-
87
-
88
-
89
-
90
-
91
-
92
-
93
-
94
-
95
-
 96
96 -
 97
97 -
 98
98 -
 99
99 -
 100
100 -
 101
101 -
 102
102 -
 103
103 -
 104
104 -
 105
105 -
 106
106 -
 107
107 -
 108
108 -
 109
109 -
 110
110 -
 111
111 -
 112
112 -
 113
113 -
 114
114 -
 115
115 -
 116
116 -
117
-
118
-
119
-
120
-
121
-
122
-
123
-
124
-
125
-
126
-
127
-
128
-
129
-
130
-
131
-
132
-
133
-
134
-
135
-
136
-
137
-
138
-
139
-
140
-
141
-
142
-
143
-
144
-
145
-
146
-
147
-
148
-
149
-
150
-
151
-
152
-
153
-
154
-
155
-
156
-
157
-
158
-
159
-
160
-
161
-
162
-
163
-
164
-
165
-
166
-
167
-
168
-
169
-
170
-
171
-
172
-
173
-
174
-
175
-
176
-
177
-
178
-
179
-
180
-
181
-
182
-
183
-
184
-
185
-
186
-
187
-
188
-
189
-
190
-
191
-
192
-
193
-
194
-
195
-
196
-
197
-
198
-
199
-
200
-
201
-
202
-
203
-
204
-
205
-
206
-
207
-
208
-
209
-
210
-
211
-
212
-
213
-
214
-
215
-
216
-
217
-
218
-
219
-
220
-
221
-
222
-
223
-
224
-
225
-
226
-
227
-
228
-
229
-
230
-
231
-
232
-
233
-
234
-
235
-
236
-
237
-
238
-
239
-
240
-
241
-
242
-
243
-
244
-
245
-
246
-
247
-
248
-
249
-
250
-
251
-
252
-
253
-
254
-
255
 |
 |

106
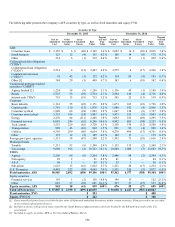
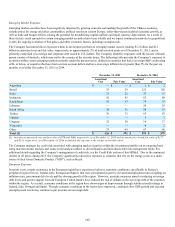
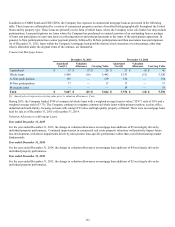
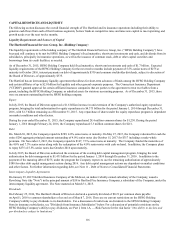
The following table presents the Company’s AFS securities by type, as well as fixed maturities and equity, FVO.
Securities by Type
December 31, 2015 December 31, 2014
Cost or
Amortized
Cost
Gross
Unrealized
Gains
Gross
Unrealized
Losses Fair
Value
Percent
of Total
Fair
Value
Cost or
Amortized
Cost
Gross
Unrealized
Gains
Gross
Unrealized
Losses Fair
Value
Percent
of Total
Fair
Value
ABS
Consumer loans $ 2,183 $ 6 $ (40) $ 2,149 3.6 % $ 2,052 $ 14 $ (28) $ 2,038 3.4 %
Small business 123 12 (4) 131 0.2 % 166 14 (8) 172 0.3 %
Other 214 6 (1) 219 0.4 % 252 11 (1) 262 0.4 %
Collateralized debt obligations
("CDOs")
Collateralized loan obligations
("CLOs") 2,514 4 (21) 2,497 4.2 % 2,279 4 (17) 2,266 3.8 %
Commercial real estate
("CREs") 91 42 (1) 132 0.2 % 114 88 (9) 193 0.3 %
Other [1] 384 29 (1) 409 0.7 % 383 6 (10) 382 0.6 %
Commercial mortgage-backed
securities ("CMBS")
Agency backed [2] 1,224 34 (8) 1,250 2.1 % 1,136 45 (1) 1,180 2.0 %
Bonds 2,725 58 (29) 2,754 4.7 % 2,594 126 (4) 2,716 4.6 %
Interest only (“IOs”) 719 13 (19) 713 1.2 % 505 25 (11) 519 0.9 %
Corporate
Basic industry 1,161 55 (45) 1,171 2.0 % 1,673 105 (22) 1,756 3.0 %
Capital goods 1,781 110 (15) 1,876 3.2 % 1,880 192 (4) 2,068 3.5 %
Consumer cyclical 1,848 68 (24) 1,892 3.2 % 1,647 128 (8) 1,767 3.0 %
Consumer non-cyclical 3,735 196 (24) 3,907 6.6 % 3,473 335 (5) 3,803 6.4 %
Energy 2,276 84 (111) 2,249 3.8 % 3,092 252 (49) 3,295 5.5 %
Financial services 6,083 246 (63) 6,266 10.6 % 4,942 405 (94) 5,253 8.8 %
Tech./comm. 3,553 229 (62) 3,720 6.3 % 3,150 370 (12) 3,508 5.9 %
Transportation 869 43 (10) 902 1.5 % 891 82 (4) 969 1.6 %
Utilities 4,395 299 (60) 4,634 7.8 % 4,278 496 (13) 4,761 8.0 %
Other 175 12 (2) 185 0.3 % 162 17 — 179 0.3 %
Foreign govt./govt. agencies 1,321 34 (47) 1,308 2.2 % 1,592 73 (29) 1,636 2.8 %
Municipal bonds
Taxable 1,315 92 (9) 1,398 2.4 % 1,135 135 (2) 1,268 2.1 %
Tax-exempt 9,809 916 (2) 10,723 18.1 % 10,600 1,006 (3) 11,603 19.5 %
RMBS
Agency 2,206 64 (6) 2,264 3.8 % 2,448 98 (2) 2,544 4.3 %
Non-agency 89 2 — 91 0.2 % 81 3 — 84 0.1 %
Alt-A 68 1 — 69 0.1 % 55 1 — 56 0.1 %
Sub-prime 1,623 15 (16) 1,622 2.7 % 1,231 20 (17) 1,234 2.1 %
U.S. Treasuries 4,481 222 (38) 4,665 7.9 % 3,551 326 (5) 3,872 6.5 %
Fixed maturities, AFS 56,965 2,892 (658) 59,196 100% 55,362 4,377 (358) 59,384 100%
Equity securities
Financial services 159 1 (2) 158 18.8 % 149 13 — 162 23.2 %
Other 683 37 (39) 681 81.2 % 527 37 (27) 537 76.8 %
Equity securities, AFS 842 38 (41) 839 100% 676 50 (27) 699 100%
Total AFS securities $ 57,807 $ 2,930 $ (699) $ 60,035 $ 56,038 $ 4,427 $ (385) $ 60,083
Fixed maturities, FVO $ 503 $ 488
Equity, FVO [3] $ 282 $ 348
[1] Gross unrealized gains (losses) exclude the fair value of bifurcated embedded derivatives within certain securities. Changes in value are recorded
in net realized capital gains (losses).
[2] Includes securities with pools of loans issued by the Small Business Administration which are backed by the full faith and credit of the U.S.
government.
[3] Included in equity securities, AFS on the Consolidated Balance Sheets.