The Hartford 2015 Annual Report Download - page 192
Download and view the complete annual report
Please find page 192 of the 2015 The Hartford annual report below. You can navigate through the pages in the report by either clicking on the pages listed below, or by using the keyword search tool below to find specific information within the annual report.-
 1
1 -
2
-
3
-
4
-
5
-
6
-
7
-
8
-
9
-
10
-
11
-
12
-
13
-
14
-
15
-
16
-
17
-
18
-
19
-
20
-
21
-
22
-
23
-
24
-
25
-
26
-
27
-
28
-
29
-
30
-
31
-
32
-
33
-
34
-
35
-
36
-
37
-
38
-
39
-
40
-
41
-
42
-
43
-
44
-
45
-
46
-
47
-
48
-
49
-
50
-
51
-
52
-
53
-
54
-
55
-
56
-
57
-
58
-
59
-
60
-
61
-
62
-
63
-
64
-
65
-
66
-
67
-
68
-
69
-
70
-
71
-
72
-
73
-
74
-
75
-
76
-
77
-
78
-
79
-
80
-
81
-
82
-
83
-
84
-
85
-
86
-
87
-
88
-
89
-
90
-
91
-
92
-
93
-
94
-
95
-
96
-
97
-
98
-
99
-
100
-
101
-
102
-
103
-
104
-
105
-
106
-
107
-
108
-
109
-
110
-
111
-
112
-
113
-
114
-
115
-
116
-
117
-
118
-
119
-
120
-
121
-
122
-
123
-
124
-
125
-
126
-
127
-
128
-
129
-
130
-
131
-
132
-
133
-
134
-
135
-
136
-
137
-
138
-
139
-
140
-
141
-
142
-
143
-
144
-
145
-
146
-
147
-
148
-
149
-
150
-
151
-
152
-
153
-
154
-
155
-
156
-
157
-
158
-
159
-
160
-
161
-
162
-
163
-
164
-
165
-
166
-
167
-
168
-
169
-
170
-
171
-
172
-
173
-
174
-
175
-
176
-
177
-
178
-
179
-
180
-
181
-
 182
182 -
 183
183 -
 184
184 -
 185
185 -
 186
186 -
 187
187 -
 188
188 -
 189
189 -
 190
190 -
 191
191 -
 192
192 -
 193
193 -
 194
194 -
 195
195 -
 196
196 -
 197
197 -
 198
198 -
 199
199 -
 200
200 -
 201
201 -
 202
202 -
203
-
204
-
205
-
206
-
207
-
208
-
209
-
210
-
211
-
212
-
213
-
214
-
215
-
216
-
217
-
218
-
219
-
220
-
221
-
222
-
223
-
224
-
225
-
226
-
227
-
228
-
229
-
230
-
231
-
232
-
233
-
234
-
235
-
236
-
237
-
238
-
239
-
240
-
241
-
242
-
243
-
244
-
245
-
246
-
247
-
248
-
249
-
250
-
251
-
252
-
253
-
254
-
255
 |
 |

Table of Contents THE HARTFORD FINANCIAL SERVICES GROUP, INC.
NOTES TO CONSOLIDATED FINANCIAL STATEMENTS (continued)
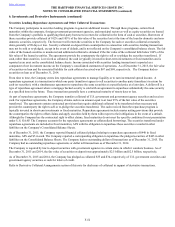
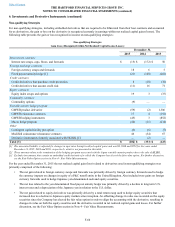
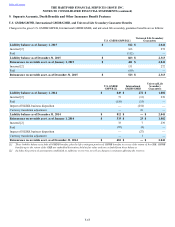
6. Investments and Derivative Instruments (continued)
F-61
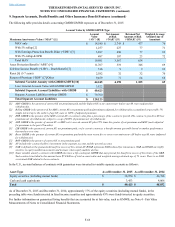
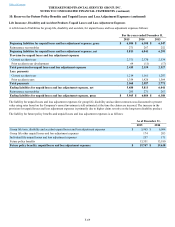
• The net loss related to the combined GMWB hedging program, which includes the GMWB product, reinsurance, and hedging
derivatives, was primarily driven by liability model assumption updates, and underperformance of the underlying actively
managed funds compared to their respective indices.
• The net loss on the macro hedge program was primarily due to time decay on options.
• The gain associated with modified coinsurance reinsurance contracts, which are accounted for as embedded derivatives and
transfer to the reinsurer the investment experience related to the assets supporting the reinsured policies, was primarily driven
by widening credit spreads and an increase in interest rates. The assets remain on the Company's books and the Company
recorded an offsetting gain in AOCI as a result of the increase in market value of the bonds.
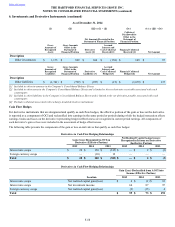
In addition, for the years ended December 31, 2015 and 2014, the Company recognized gains of $3 and $13, respectively, due to cash
recovered on derivative receivables that were previously written-off related to the bankruptcy of Lehman Brothers Inc. The derivative
receivables were the result of the contractual collateral threshold amounts and open collateral calls prior to the bankruptcy filing as well
as interest rate and credit spread movements from the date of the last collateral call to the date of the bankruptcy filing. For the year
ended December 31, 2013, there were no recognized gains due to derivative receivables that were previously written-off related to the
bankruptcy of Lehman Brothers Inc.
For the year ended December 31, 2014 the net realized capital gain (loss) related to derivatives used in non-qualifying strategies was
primarily comprised of the following:
• The net loss related to interest rate derivatives was driven by a decline in U.S. interest rates.
• The net loss related to the yen denominated fixed annuity payout hedge was primarily driven by a decline in U.S. interest rates
and a depreciation of the Japanese yen in relation to the U.S. dollar.
• The loss associated with modified coinsurance reinsurance contracts, which are accounted for as embedded derivatives and
transfer to the reinsurer the investment experience related to the assets supporting the reinsured policies, was primarily driven
by a decline in long-term interest rates, partially offset by credit spread widening. The assets remain on the Company's books
and the Company recorded an offsetting gain in AOCI as a result of the increase in market value of the bonds.
For the year ended December 31, 2013 the net realized capital gain (loss) related to derivatives used in non-qualifying strategies was
primarily due to the following:
• The net loss related to the yen denominated fixed payout annuity hedge was primarily driven by a depreciation of the Japanese
yen in relation to the U.S. dollar.
• The net loss on the macro hedge program was primarily due to an improvement in domestic equity markets, and a decline in
equity volatility.
• The net gain related to the combined GMWB hedging program, which includes the GMWB product, reinsurance, and hedging
derivatives, was primarily driven by revaluing the liability for living benefits resulting from favorable policyholder behavior
largely related to increased full surrenders and liability model assumption updates for partial lapses and withdrawal rates.
Refer to Note 12 - Commitments and Contingencies for additional disclosures regarding contingent credit related features in derivative
agreements.
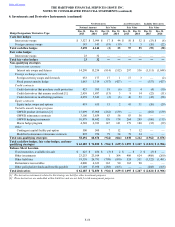
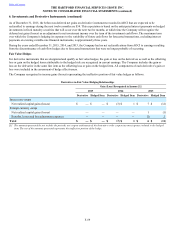
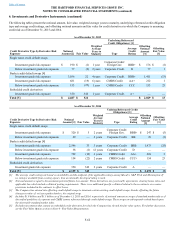
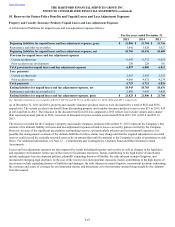
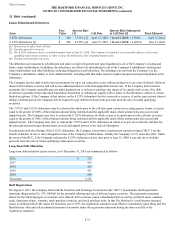
Credit Risk Assumed through Credit Derivatives
The Company enters into credit default swaps that assume credit risk of a single entity or referenced index in order to synthetically
replicate investment transactions that would be permissible under the Company's investment policies. The Company will receive
periodic payments based on an agreed upon rate and notional amount and will only make a payment if there is a credit event. A credit
event payment will typically be equal to the notional value of the swap contract less the value of the referenced security issuer’s debt
obligation after the occurrence of the credit event. A credit event is generally defined as a default on contractually obligated interest or
principal payments or bankruptcy of the referenced entity. The credit default swaps in which the Company assumes credit risk primarily
reference investment grade single corporate issuers and baskets, which include standard diversified portfolios of corporate and CMBS
issuers. The diversified portfolios of corporate issuers are established within sector concentration limits and may be divided into tranches
that possess different credit ratings.