The Hartford 2015 Annual Report Download - page 74
Download and view the complete annual report
Please find page 74 of the 2015 The Hartford annual report below. You can navigate through the pages in the report by either clicking on the pages listed below, or by using the keyword search tool below to find specific information within the annual report.-
 1
1 -
2
-
3
-
4
-
5
-
6
-
7
-
8
-
9
-
10
-
11
-
12
-
13
-
14
-
15
-
16
-
17
-
18
-
19
-
20
-
21
-
22
-
23
-
24
-
25
-
26
-
27
-
28
-
29
-
30
-
31
-
32
-
33
-
34
-
35
-
36
-
37
-
38
-
39
-
40
-
41
-
42
-
43
-
44
-
45
-
46
-
47
-
48
-
49
-
50
-
51
-
52
-
53
-
54
-
55
-
56
-
57
-
58
-
59
-
60
-
61
-
62
-
63
-
 64
64 -
 65
65 -
 66
66 -
 67
67 -
 68
68 -
 69
69 -
 70
70 -
 71
71 -
 72
72 -
 73
73 -
 74
74 -
 75
75 -
 76
76 -
 77
77 -
 78
78 -
 79
79 -
 80
80 -
 81
81 -
 82
82 -
 83
83 -
 84
84 -
85
-
86
-
87
-
88
-
89
-
90
-
91
-
92
-
93
-
94
-
95
-
96
-
97
-
98
-
99
-
100
-
101
-
102
-
103
-
104
-
105
-
106
-
107
-
108
-
109
-
110
-
111
-
112
-
113
-
114
-
115
-
116
-
117
-
118
-
119
-
120
-
121
-
122
-
123
-
124
-
125
-
126
-
127
-
128
-
129
-
130
-
131
-
132
-
133
-
134
-
135
-
136
-
137
-
138
-
139
-
140
-
141
-
142
-
143
-
144
-
145
-
146
-
147
-
148
-
149
-
150
-
151
-
152
-
153
-
154
-
155
-
156
-
157
-
158
-
159
-
160
-
161
-
162
-
163
-
164
-
165
-
166
-
167
-
168
-
169
-
170
-
171
-
172
-
173
-
174
-
175
-
176
-
177
-
178
-
179
-
180
-
181
-
182
-
183
-
184
-
185
-
186
-
187
-
188
-
189
-
190
-
191
-
192
-
193
-
194
-
195
-
196
-
197
-
198
-
199
-
200
-
201
-
202
-
203
-
204
-
205
-
206
-
207
-
208
-
209
-
210
-
211
-
212
-
213
-
214
-
215
-
216
-
217
-
218
-
219
-
220
-
221
-
222
-
223
-
224
-
225
-
226
-
227
-
228
-
229
-
230
-
231
-
232
-
233
-
234
-
235
-
236
-
237
-
238
-
239
-
240
-
241
-
242
-
243
-
244
-
245
-
246
-
247
-
248
-
249
-
250
-
251
-
252
-
253
-
254
-
255
 |
 |
74
2016 Outlook
The Company expects economic conditions to continue to improve slowly driving a modest increase in exposures, while pricing is
anticipated to further moderate. As such, the Company expects low single-digit written premiums growth in 2016 driven by small
commercial and middle market where the Company continues to develop comprehensive product solutions, deeper relationships with
distribution partners, differentiating customer experiences and enhanced ease of doing business processes and technologies. In specialty
lines, the Company expects flat written premium growth as increases in bond and professional liability are expected to be offset by a
decline in national accounts. The Company expects the Commercial Lines combined ratio before catastrophes and prior accident year
development will be between approximately 89.0 and 91.0 for 2016, compared to 90.0 in 2015, as earned pricing increases are expected
to be in-line with long-term loss costs trends.
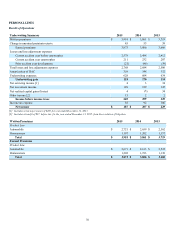
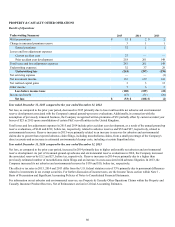
Year ended December 31, 2015 compared to the year ended December 31, 2014
Overview
Net income increased in 2015, as compared to the prior year period, primarily due to a higher underwriting gain and lower realized
capital losses, partially offset by lower net investment income. The increase in underwriting gain was primarily driven by a lower
current accident year loss and loss adjustment expense ratio before catastrophes, partially offset by higher underwriting expenses and
unfavorable prior accident year development. Underwriting expenses in 2014 included a reduction of $49, before tax, in the Company's
estimated liability for NY State Workers' Compensation Board assessments.
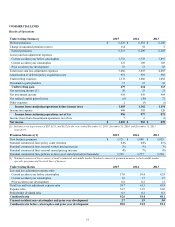
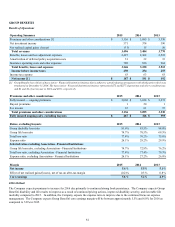
Revenues - Earned and Written Premiums
Earned premiums increased in 2015, as compared to the prior year period, reflecting written premium growth over the preceding twelve
months.
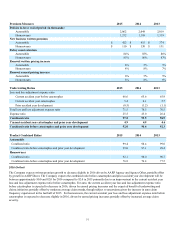
Written premiums, as compared to prior year period, increased in 2015 in small commercial, middle market and specialty commercial
lines. Written premium increased in all small commercial lines of business, particularly in workers’ compensation driven by higher new,
renewal and audit premium, as well as in Spectrum package business driven by higher new and renewal premium. Written premium
increased in middle market driven primarily by higher new, renewal and audit premium in construction as well as higher new and
renewal premium in marine. Written premium increased in specialty commercial primarily as a result of higher retrospective premium on
loss sensitive business in national accounts.
Losses and Loss Adjustment Expenses
Losses and loss adjustment expenses increased in 2015, as compared to the prior year period, reflecting earned premium growth,
unfavorable prior accident year development and modestly higher catastrophes.
• The decrease in the current accident year loss and loss adjustment expense ratio before catastrophes in 2015, as compared to the
prior year period, was primarily driven by lower loss and loss adjustment expense ratios in workers' compensation, general
liability and financial products, as well as lower non-catastrophe property losses. The decrease in workers compensation was
due to earned pricing increases and declining frequency, partially offset by modestly higher severity. Accordingly, the current
accident year loss and loss adjustment expense ratio before catastrophes decreased by 2.4 points to 57.0 in 2015 from 59.4 in
2014.
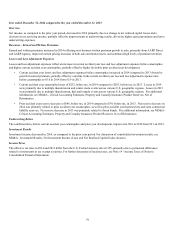
• Current accident year catastrophe losses totaled $121, before tax, in 2015, compared to $109, before tax, in 2014. Catastrophe
losses for both years were primarily due to winter storms and wind and hail events across various U.S. geographic regions. For
additional information, see MD&A - Critical Accounting Estimates, Property and Casualty Insurance Product Reserves, Net of
Reinsurance.
• Prior accident year reserves increased $53, before tax, in 2015, compared to $13, before tax, in 2014. Net reserve increases in
2015 were primarily related to commercial auto liability and package business, as well as workers' compensation discount
accretion, partially offset by a decrease in reserves for workers’ compensation and professional liability. For additional
information, see MD&A - Critical Accounting Estimates, Reserve Roll-forwards and Development.
Underwriting Ratios
The combined ratio, before catastrophes and prior year development, decreased 1.5 points to 90.0 in 2015 from 91.5 in 2014 reflecting
improvements in all three business lines within Commercial Lines. The decrease reflected a decrease in the current accident year loss
and loss adjustment expense ratio before catastrophes.
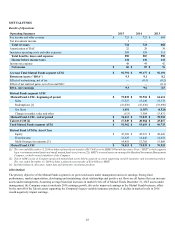
Investment Results
Investment income decreased in 2015, as compared to the prior year period. For discussion of consolidated investment results, see
MD&A - Investment Results, Net Investment Income (Loss) and Net Realized Capital Gains (Losses).