The Hartford 2015 Annual Report Download - page 159
Download and view the complete annual report
Please find page 159 of the 2015 The Hartford annual report below. You can navigate through the pages in the report by either clicking on the pages listed below, or by using the keyword search tool below to find specific information within the annual report.-
 1
1 -
2
-
3
-
4
-
5
-
6
-
7
-
8
-
9
-
10
-
11
-
12
-
13
-
14
-
15
-
16
-
17
-
18
-
19
-
20
-
21
-
22
-
23
-
24
-
25
-
26
-
27
-
28
-
29
-
30
-
31
-
32
-
33
-
34
-
35
-
36
-
37
-
38
-
39
-
40
-
41
-
42
-
43
-
44
-
45
-
46
-
47
-
48
-
49
-
50
-
51
-
52
-
53
-
54
-
55
-
56
-
57
-
58
-
59
-
60
-
61
-
62
-
63
-
64
-
65
-
66
-
67
-
68
-
69
-
70
-
71
-
72
-
73
-
74
-
75
-
76
-
77
-
78
-
79
-
80
-
81
-
82
-
83
-
84
-
85
-
86
-
87
-
88
-
89
-
90
-
91
-
92
-
93
-
94
-
95
-
96
-
97
-
98
-
99
-
100
-
101
-
102
-
103
-
104
-
105
-
106
-
107
-
108
-
109
-
110
-
111
-
112
-
113
-
114
-
115
-
116
-
117
-
118
-
119
-
120
-
121
-
122
-
123
-
124
-
125
-
126
-
127
-
128
-
129
-
130
-
131
-
132
-
133
-
134
-
135
-
136
-
137
-
138
-
139
-
140
-
141
-
142
-
143
-
144
-
145
-
146
-
147
-
148
-
 149
149 -
 150
150 -
 151
151 -
 152
152 -
 153
153 -
 154
154 -
 155
155 -
 156
156 -
 157
157 -
 158
158 -
 159
159 -
 160
160 -
 161
161 -
 162
162 -
 163
163 -
 164
164 -
 165
165 -
 166
166 -
 167
167 -
 168
168 -
 169
169 -
170
-
171
-
172
-
173
-
174
-
175
-
176
-
177
-
178
-
179
-
180
-
181
-
182
-
183
-
184
-
185
-
186
-
187
-
188
-
189
-
190
-
191
-
192
-
193
-
194
-
195
-
196
-
197
-
198
-
199
-
200
-
201
-
202
-
203
-
204
-
205
-
206
-
207
-
208
-
209
-
210
-
211
-
212
-
213
-
214
-
215
-
216
-
217
-
218
-
219
-
220
-
221
-
222
-
223
-
224
-
225
-
226
-
227
-
228
-
229
-
230
-
231
-
232
-
233
-
234
-
235
-
236
-
237
-
238
-
239
-
240
-
241
-
242
-
243
-
244
-
245
-
246
-
247
-
248
-
249
-
250
-
251
-
252
-
253
-
254
-
255
 |
 |

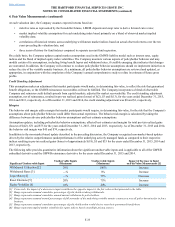
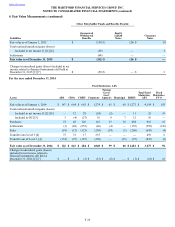
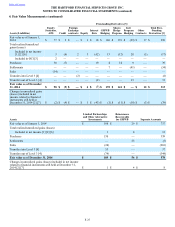
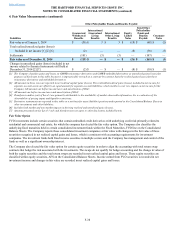
Table of Contents THE HARTFORD FINANCIAL SERVICES GROUP, INC.
NOTES TO CONSOLIDATED FINANCIAL STATEMENTS (continued)
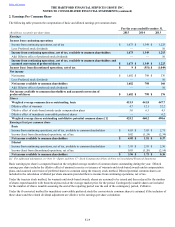
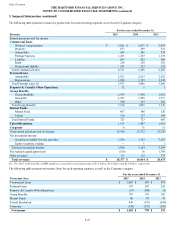
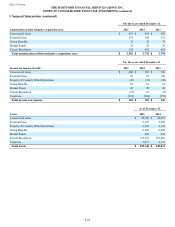
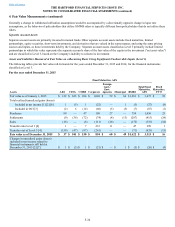
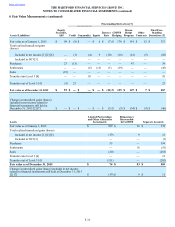
4. Fair Value Measurements (continued)
F-28
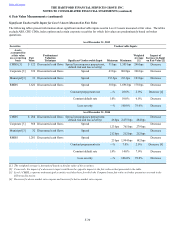
Limited Partnerships and Other Alternative Investments
The portion of limited partnerships and other alternative investments recorded at fair value includes hedge funds for which investment
company accounting has been applied to a wholly-owned fund of funds measured at fair value. Fair value is determined for these funds
using the NAV, as a practical expedient, calculated on a monthly basis, and is the amount at which a unit or shareholder may redeem
their investment, if redemption is allowed. Certain impediments to redemption include, but are not limited to the following: 1)
redemption notice periods vary and may be as long as 90 days, 2) redemption may be restricted (e.g. only be allowed on a quarter-end),
3) a holding period referred to as a lock-up may be imposed whereby an investor must hold their investment for a specified period of
time before they can make a notice for redemption, 4) gating provisions may limit all redemptions in a given period to a percentage of
the entities' equity interests, or may only allow an investor to redeem a portion of their investment at one time and 5) early redemption
penalties may be imposed that are expressed as a percentage of the amount redeemed. The Company regularly assesses impediments to
redemption and current market conditions that will restrict the redemption at the end of the notice period. Any funds that are subject to
significant liquidity restrictions are reported in Level 3; all others are classified as Level 2.
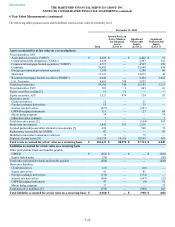
Valuation Inputs for Investments
For Level 1 investments, which are comprised of on-the-run U.S. Treasuries, money market funds, exchange-traded equity securities,
open-ended mutual funds, short-term investments, and exchange traded futures and option contracts, valuations are based on quoted
prices for identical assets in active markets that the Company has the ability to access at the measurement date.
For the Company’s Level 2 and 3 debt securities, typical inputs used by pricing techniques include, but are not limited to, benchmark
yields, reported trades, broker/dealer quotes, issuer spreads, benchmark securities, bids, offers, and/or estimated cash flows, prepayment
speeds, and default rates. Derivative instruments are valued using mid-market inputs that are predominantly observable in the market.
A description of additional inputs used in the Company’s Level 2 and Level 3 measurements is included in the following discussion:
Level 2 The fair values of most of the Company’s Level 2 investments are determined by management after considering prices
received from third party pricing services. These investments include most fixed maturities and preferred stocks, including
those reported in separate account assets, as well as, certain hedge funds and derivative instruments.
• ABS, CDOs, CMBS and RMBS – Primary inputs also include monthly payment information, collateral
performance, which varies by vintage year and includes delinquency rates, collateral valuation loss severity rates,
collateral refinancing assumptions, and credit default swap indices. ABS and RMBS prices also include estimates
of the rate of future principal prepayments over the remaining life of the securities. These estimates are derived
based on the characteristics of the underlying structure and prepayment speeds previously experienced at the
interest rate levels projected for the underlying collateral.
• Corporates, including investment grade private placements – Primary inputs also include observations of credit
default swap curves related to the issuer.
• Foreign government/government agencies – Primary inputs also include observations of credit default swap
curves related to the issuer and political events in emerging market economies.
• Municipals – Primary inputs also include Municipal Securities Rulemaking Board reported trades and material
event notices, and issuer financial statements.
• Short-term investments – Primary inputs also include material event notices and new issue money market rates.
• Credit derivatives – Primary inputs include the swap yield curve and credit default swap curves.
• Foreign exchange derivatives – Primary inputs include the swap yield curve, currency spot and forward rates, and
cross currency basis curves.
• Interest rate derivatives – Primary input is the swap yield curve.
• Equity derivatives – Primary inputs include equity index levels.
• Limited partnerships and other alternative investments – Primary inputs include a NAV for investment companies
with no redemption restrictions as reported on their U.S. GAAP financial statements, which are generally on a
one-month delay.