The Hartford 2015 Annual Report Download - page 178
Download and view the complete annual report
Please find page 178 of the 2015 The Hartford annual report below. You can navigate through the pages in the report by either clicking on the pages listed below, or by using the keyword search tool below to find specific information within the annual report.-
 1
1 -
2
-
3
-
4
-
5
-
6
-
7
-
8
-
9
-
10
-
11
-
12
-
13
-
14
-
15
-
16
-
17
-
18
-
19
-
20
-
21
-
22
-
23
-
24
-
25
-
26
-
27
-
28
-
29
-
30
-
31
-
32
-
33
-
34
-
35
-
36
-
37
-
38
-
39
-
40
-
41
-
42
-
43
-
44
-
45
-
46
-
47
-
48
-
49
-
50
-
51
-
52
-
53
-
54
-
55
-
56
-
57
-
58
-
59
-
60
-
61
-
62
-
63
-
64
-
65
-
66
-
67
-
68
-
69
-
70
-
71
-
72
-
73
-
74
-
75
-
76
-
77
-
78
-
79
-
80
-
81
-
82
-
83
-
84
-
85
-
86
-
87
-
88
-
89
-
90
-
91
-
92
-
93
-
94
-
95
-
96
-
97
-
98
-
99
-
100
-
101
-
102
-
103
-
104
-
105
-
106
-
107
-
108
-
109
-
110
-
111
-
112
-
113
-
114
-
115
-
116
-
117
-
118
-
119
-
120
-
121
-
122
-
123
-
124
-
125
-
126
-
127
-
128
-
129
-
130
-
131
-
132
-
133
-
134
-
135
-
136
-
137
-
138
-
139
-
140
-
141
-
142
-
143
-
144
-
145
-
146
-
147
-
148
-
149
-
150
-
151
-
152
-
153
-
154
-
155
-
156
-
157
-
158
-
159
-
160
-
161
-
162
-
163
-
164
-
165
-
166
-
167
-
 168
168 -
 169
169 -
 170
170 -
 171
171 -
 172
172 -
 173
173 -
 174
174 -
 175
175 -
 176
176 -
 177
177 -
 178
178 -
 179
179 -
 180
180 -
 181
181 -
 182
182 -
 183
183 -
 184
184 -
 185
185 -
 186
186 -
 187
187 -
 188
188 -
189
-
190
-
191
-
192
-
193
-
194
-
195
-
196
-
197
-
198
-
199
-
200
-
201
-
202
-
203
-
204
-
205
-
206
-
207
-
208
-
209
-
210
-
211
-
212
-
213
-
214
-
215
-
216
-
217
-
218
-
219
-
220
-
221
-
222
-
223
-
224
-
225
-
226
-
227
-
228
-
229
-
230
-
231
-
232
-
233
-
234
-
235
-
236
-
237
-
238
-
239
-
240
-
241
-
242
-
243
-
244
-
245
-
246
-
247
-
248
-
249
-
250
-
251
-
252
-
253
-
254
-
255
 |
 |

Table of Contents THE HARTFORD FINANCIAL SERVICES GROUP, INC.
NOTES TO CONSOLIDATED FINANCIAL STATEMENTS (continued)
6. Investments and Derivative Instruments (continued)
F-47
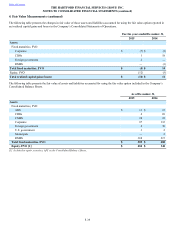
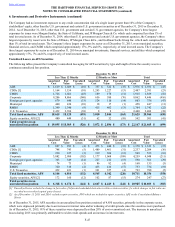
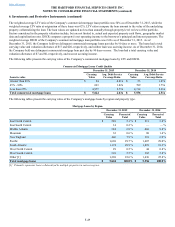
The Company had no investment exposure to any credit concentration risk of a single issuer greater than 10% of the Company's
stockholders' equity, other than the U.S. government and certain U.S. government securities as of December 31, 2015 or December 31,
2014. As of December 31, 2015, other than U.S. government and certain U.S. government agencies, the Company’s three largest
exposures by issuer were Morgan Stanley, the State of California, and JP Morgan Chase & Co. which each comprised less than 1% of
total invested assets. As of December 31, 2014, other than U.S. government and certain U.S. government agencies, the Company’s three
largest exposures by issuer were the State of Illinois, JP Morgan Chase &Co., and Goldman Sachs Group Inc. which each comprised less
than 1% of total invested assets. The Company’s three largest exposures by sector as of December 31, 2015, were municipal securities,
financial services, and CMBS which comprised approximately 17%, 9% and 6%, respectively, of total invested assets. The Company’s
three largest exposures by sector as of December 31, 2014 were municipal investments, financial services, and utilities which comprised
approximately 17%, 7% and 6%, respectively, of total invested assets.
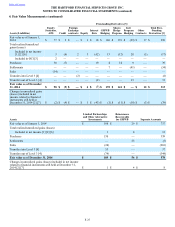
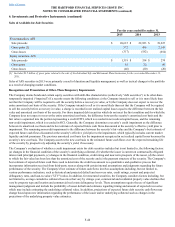
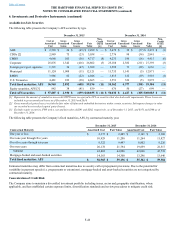
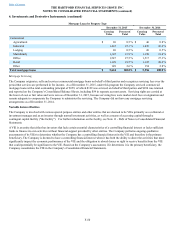
Unrealized Losses on AFS Securities
The following tables present the Company’s unrealized loss aging for AFS securities by type and length of time the security was in a
continuous unrealized loss position.
December 31, 2015
Less Than 12 Months 12 Months or More Total
Amortized
Cost Fair
Value Unrealized
Losses Amortized
Cost Fair
Value Unrealized
Losses Amortized
Cost Fair
Value Unrealized
Losses
ABS $ 1,619 $ 1,609 $ (10) $ 357 $ 322 $ (35) $ 1,976 $ 1,931 $ (45)
CDOs [1] 1,164 1,154 (10) 1,243 1,227 (13) 2,407 2,381 (23)
CMBS 1,726 1,681 (45) 189 178 (11) 1,915 1,859 (56)
Corporate 9,206 8,866 (340) 656 580 (76) 9,862 9,446 (416)
Foreign govt./govt. agencies 679 646 (33) 124 110 (14) 803 756 (47)
Municipal 440 430 (10) 18 17 (1) 458 447 (11)
RMBS 1,349 1,340 (9) 415 402 (13) 1,764 1,742 (22)
U.S. Treasuries 2,432 2,394 (38) 8 8 — 2,440 2,402 (38)
Total fixed maturities, AFS 18,615 18,120 (495) 3,010 2,844 (163) 21,625 20,964 (658)
Equity securities, AFS [2] 480 449 (31) 62 52 (10) 542 501 (41)
Total securities in an
unrealized loss position $ 19,095 $ 18,569 $ (526) $ 3,072 $ 2,896 $ (173) $ 22,167 $ 21,465 $ (699)
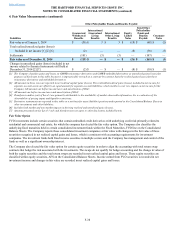
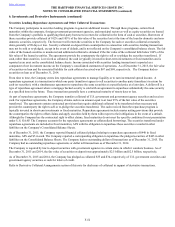
December 31, 2014
Less Than 12 Months 12 Months or More Total
Amortized
Cost Fair
Value Unrealized
Losses Amortized
Cost Fair
Value Unrealized
Losses Amortized
Cost Fair
Value Unrealized
Losses
ABS $ 897 $ 893 $ (4) $ 473 $ 440 $ (33) $ 1,370 $ 1,333 $ (37)
CDOs [1] 748 743 (5) 1,489 1,461 (31) 2,237 2,204 (36)
CMBS 230 227 (3) 319 306 (13) 549 533 (16)
Corporate 3,082 2,980 (102) 1,177 1,068 (109) 4,259 4,048 (211)
Foreign govt./govt. agencies 363 349 (14) 227 212 (15) 590 561 (29)
Municipal 74 73 (1) 86 82 (4) 160 155 (5)
RMBS 320 318 (2) 433 416 (17) 753 734 (19)
U.S. Treasuries 432 431 (1) 361 357 (4) 793 788 (5)
Total fixed maturities, AFS 6,146 6,014 (132) 4,565 4,342 (226) 10,711 10,356 (358)
Equity securities, AFS [2] 172 160 (12) 102 87 (15) 274 247 (27)
Total securities in an
unrealized loss position $ 6,318 $ 6,174 $ (144) $ 4,667 $ 4,429 $ (241) $ 10,985 $ 10,603 $ (385)
[1] Unrealized losses exclude the change in fair value of bifurcated embedded derivatives within certain securities, for which changes in fair value are
recorded in net realized capital gains (losses).
[2] As of December 31, 2015 and 2014, excludes equity securities, FVO which are included in equity securities, AFS on the Consolidated Balance
Sheets.
As of December 31, 2015, AFS securities in an unrealized loss position consisted of 4,850 securities, primarily in the corporate sector,
which were depressed primarily due to an increase in interest rates and/or widening of credit spreads since the securities were purchased.
As of December 31, 2015, 91% of these securities were depressed less than 20% of cost or amortized cost. The increase in unrealized
losses during 2015 was primarily attributable to wider credit spreads and an increase in interest rates.