The Hartford 2015 Annual Report Download - page 180
Download and view the complete annual report
Please find page 180 of the 2015 The Hartford annual report below. You can navigate through the pages in the report by either clicking on the pages listed below, or by using the keyword search tool below to find specific information within the annual report.-
 1
1 -
 2
2 -
 3
3 -
 4
4 -
 5
5 -
 6
6 -
 7
7 -
 8
8 -
 9
9 -
 10
10 -
 11
11 -
 12
12 -
 13
13 -
 14
14 -
 15
15 -
 16
16 -
 17
17 -
 18
18 -
 19
19 -
 20
20 -
 21
21 -
 22
22 -
 23
23 -
 24
24 -
 25
25 -
 26
26 -
 27
27 -
 28
28 -
 29
29 -
 30
30 -
 31
31 -
 32
32 -
 33
33 -
 34
34 -
 35
35 -
 36
36 -
 37
37 -
 38
38 -
 39
39 -
 40
40 -
 41
41 -
 42
42 -
 43
43 -
 44
44 -
 45
45 -
 46
46 -
 47
47 -
 48
48 -
 49
49 -
 50
50 -
 51
51 -
 52
52 -
 53
53 -
 54
54 -
 55
55 -
 56
56 -
 57
57 -
 58
58 -
 59
59 -
 60
60 -
 61
61 -
 62
62 -
 63
63 -
 64
64 -
 65
65 -
 66
66 -
 67
67 -
 68
68 -
 69
69 -
 70
70 -
 71
71 -
 72
72 -
 73
73 -
 74
74 -
 75
75 -
 76
76 -
 77
77 -
 78
78 -
 79
79 -
 80
80 -
 81
81 -
 82
82 -
 83
83 -
 84
84 -
 85
85 -
 86
86 -
 87
87 -
 88
88 -
 89
89 -
 90
90 -
 91
91 -
 92
92 -
 93
93 -
 94
94 -
 95
95 -
 96
96 -
 97
97 -
 98
98 -
 99
99 -
 100
100 -
 101
101 -
 102
102 -
 103
103 -
 104
104 -
 105
105 -
 106
106 -
 107
107 -
 108
108 -
 109
109 -
 110
110 -
 111
111 -
 112
112 -
 113
113 -
 114
114 -
 115
115 -
 116
116 -
 117
117 -
 118
118 -
 119
119 -
 120
120 -
 121
121 -
 122
122 -
 123
123 -
 124
124 -
 125
125 -
 126
126 -
 127
127 -
 128
128 -
 129
129 -
 130
130 -
 131
131 -
 132
132 -
 133
133 -
 134
134 -
 135
135 -
 136
136 -
 137
137 -
 138
138 -
 139
139 -
 140
140 -
 141
141 -
 142
142 -
 143
143 -
 144
144 -
 145
145 -
 146
146 -
 147
147 -
 148
148 -
 149
149 -
 150
150 -
 151
151 -
 152
152 -
 153
153 -
 154
154 -
 155
155 -
 156
156 -
 157
157 -
 158
158 -
 159
159 -
 160
160 -
 161
161 -
 162
162 -
 163
163 -
 164
164 -
 165
165 -
 166
166 -
 167
167 -
 168
168 -
 169
169 -
 170
170 -
 171
171 -
 172
172 -
 173
173 -
 174
174 -
 175
175 -
 176
176 -
 177
177 -
 178
178 -
 179
179 -
 180
180 -
 181
181 -
 182
182 -
 183
183 -
 184
184 -
 185
185 -
 186
186 -
 187
187 -
 188
188 -
 189
189 -
 190
190 -
 191
191 -
 192
192 -
 193
193 -
 194
194 -
 195
195 -
 196
196 -
 197
197 -
 198
198 -
 199
199 -
 200
200 -
 201
201 -
 202
202 -
 203
203 -
 204
204 -
 205
205 -
 206
206 -
 207
207 -
 208
208 -
 209
209 -
 210
210 -
 211
211 -
 212
212 -
 213
213 -
 214
214 -
 215
215 -
 216
216 -
 217
217 -
 218
218 -
 219
219 -
 220
220 -
 221
221 -
 222
222 -
 223
223 -
 224
224 -
 225
225 -
 226
226 -
 227
227 -
 228
228 -
 229
229 -
 230
230 -
 231
231 -
 232
232 -
 233
233 -
 234
234 -
 235
235 -
 236
236 -
 237
237 -
 238
238 -
 239
239 -
 240
240 -
 241
241 -
 242
242 -
 243
243 -
 244
244 -
 245
245 -
 246
246 -
 247
247 -
 248
248 -
 249
249 -
 250
250 -
 251
251 -
 252
252 -
 253
253 -
 254
254 -
 255
255
 |
 |

Table of Contents THE HARTFORD FINANCIAL SERVICES GROUP, INC.
NOTES TO CONSOLIDATED FINANCIAL STATEMENTS (continued)
6. Investments and Derivative Instruments (continued)
F-49
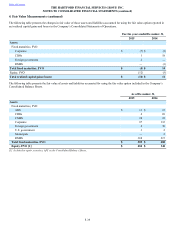
The weighted-average LTV ratio of the Company’s commercial mortgage loan portfolio was 54% as of December 31, 2015, while the
weighted-average LTV ratio at origination of these loans was 62%. LTV ratios compare the loan amount to the value of the underlying
property collateralizing the loan. The loan values are updated no less than annually through property level reviews of the portfolio.
Factors considered in the property valuation include, but are not limited to, actual and expected property cash flows, geographic market
data and capitalization rates. DSCR compares a property’s net operating income to the borrower’s principal and interest payments. The
weighted average DSCR of the Company’s commercial mortgage loan portfolio was 2.63x as of December 31, 2015. As of
December 31, 2015, the Company held two delinquent commercial mortgage loans past due by 90 days or more. The loans had a total
carrying value and valuation allowance of $17 and $20, respectively, and neither loan was accruing income. As of December 31, 2014,
the Company held one delinquent commercial mortgage loan past due by 90 days or more. The loan had a total carrying value and
valuation allowance of $7 and $0, respectively, and was not accruing income.
The following table presents the carrying value of the Company’s commercial mortgage loans by LTV and DSCR.
Commercial Mortgage Loans Credit Quality
December 31, 2015 December 31, 2014
Loan-to-value Carrying
Value Avg. Debt-Service
Coverage Ratio Carrying
Value Avg. Debt-Service
Coverage Ratio
Greater than 80% $ 24 0.81x $ 53 1.07x
65% - 80% 623 1.82x 789 1.75x
Less than 65% 4,977 2.75x 4,714 2.66x
Total commercial mortgage loans $ 5,624 2.63x $ 5,556 2.51x
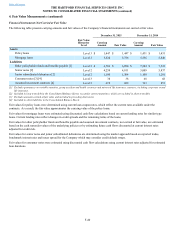
The following tables present the carrying value of the Company’s mortgage loans by region and property type.
Mortgage Loans by Region
December 31, 2015 December 31, 2014
Carrying
Value Percent of
Total Carrying
Value Percent of
Total
East North Central $ 289 5.1 % $ 211 3.8 %
East South Central 14 0.2 % — — %
Middle Atlantic 384 6.8 % 468 8.4 %
Mountain 32 0.6 % 88 1.6 %
New England 446 7.9 % 381 6.9 %
Pacific 1,669 29.7 % 1,607 29.0 %
South Atlantic 1,174 20.9 % 1,019 18.3 %
West North Central 29 0.5 % 44 0.8 %
West South Central 318 5.7 % 302 5.4 %
Other [1] 1,269 22.6 % 1,436 25.8 %
Total mortgage loans $ 5,624 100.0% $ 5,556 100.0%
[1] Primarily represents loans collateralized by multiple properties in various regions.
