The Hartford 2015 Annual Report Download - page 210
Download and view the complete annual report
Please find page 210 of the 2015 The Hartford annual report below. You can navigate through the pages in the report by either clicking on the pages listed below, or by using the keyword search tool below to find specific information within the annual report.-
 1
1 -
2
-
3
-
4
-
5
-
6
-
7
-
8
-
9
-
10
-
11
-
12
-
13
-
14
-
15
-
16
-
17
-
18
-
19
-
20
-
21
-
22
-
23
-
24
-
25
-
26
-
27
-
28
-
29
-
30
-
31
-
32
-
33
-
34
-
35
-
36
-
37
-
38
-
39
-
40
-
41
-
42
-
43
-
44
-
45
-
46
-
47
-
48
-
49
-
50
-
51
-
52
-
53
-
54
-
55
-
56
-
57
-
58
-
59
-
60
-
61
-
62
-
63
-
64
-
65
-
66
-
67
-
68
-
69
-
70
-
71
-
72
-
73
-
74
-
75
-
76
-
77
-
78
-
79
-
80
-
81
-
82
-
83
-
84
-
85
-
86
-
87
-
88
-
89
-
90
-
91
-
92
-
93
-
94
-
95
-
96
-
97
-
98
-
99
-
100
-
101
-
102
-
103
-
104
-
105
-
106
-
107
-
108
-
109
-
110
-
111
-
112
-
113
-
114
-
115
-
116
-
117
-
118
-
119
-
120
-
121
-
122
-
123
-
124
-
125
-
126
-
127
-
128
-
129
-
130
-
131
-
132
-
133
-
134
-
135
-
136
-
137
-
138
-
139
-
140
-
141
-
142
-
143
-
144
-
145
-
146
-
147
-
148
-
149
-
150
-
151
-
152
-
153
-
154
-
155
-
156
-
157
-
158
-
159
-
160
-
161
-
162
-
163
-
164
-
165
-
166
-
167
-
168
-
169
-
170
-
171
-
172
-
173
-
174
-
175
-
176
-
177
-
178
-
179
-
180
-
181
-
182
-
183
-
184
-
185
-
186
-
187
-
188
-
189
-
190
-
191
-
192
-
193
-
194
-
195
-
196
-
197
-
198
-
199
-
 200
200 -
 201
201 -
 202
202 -
 203
203 -
 204
204 -
 205
205 -
 206
206 -
 207
207 -
 208
208 -
 209
209 -
 210
210 -
 211
211 -
 212
212 -
 213
213 -
 214
214 -
 215
215 -
 216
216 -
 217
217 -
 218
218 -
 219
219 -
 220
220 -
221
-
222
-
223
-
224
-
225
-
226
-
227
-
228
-
229
-
230
-
231
-
232
-
233
-
234
-
235
-
236
-
237
-
238
-
239
-
240
-
241
-
242
-
243
-
244
-
245
-
246
-
247
-
248
-
249
-
250
-
251
-
252
-
253
-
254
-
255
 |
 |

Table of Contents THE HARTFORD FINANCIAL SERVICES GROUP, INC.
NOTES TO CONSOLIDATED FINANCIAL STATEMENTS (continued)
14. Income Taxes
F-79
The Company and its subsidiaries file income tax returns in the U.S. federal jurisdiction, and various state and foreign jurisdictions, as
applicable. Income (loss) from continuing operations before income taxes included income from domestic operations of $2,017, $1,736
and $1,473 for the years ended December 31, 2015, 2014 and 2013, and losses from foreign operations of $(39), $(37) and $(2) for the
years ended December 31, 2015, 2014 and 2013.
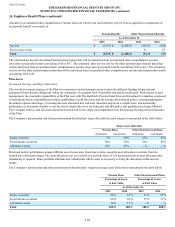
The provision (benefit) for income taxes consists of the following:
For the years ended December 31,
2015 2014 2013
Income Tax Expense (Benefit)
Current - U.S. Federal $ (55) $ (62) $ 219
International 3 2 —
Total current (52)(60) 219
Deferred - U.S. Federal 357 410 27
Total income tax expense $ 305 $ 350 $ 246
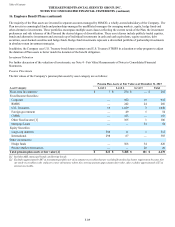
Deferred tax assets and liabilities on the consolidated balance sheets represent the tax consequences of differences between the financial
reporting and tax basis of assets and liabilities. Deferred tax assets (liabilities) include the following:
As of December 31,
Deferred Tax Assets 2015 2014
Tax discount on loss reserves $ 524 $ 573
Tax basis deferred policy acquisition costs 162 163
Unearned premium reserve and other underwriting related reserves 377 456
Investment-related items 831 1,020
Insurance product derivatives 90 44
Employee benefits 655 677
Alternative minimum tax credit 639 652
Net operating loss carryover 1,831 1,936
Foreign tax credit carryover 154 178
Capital loss carryover 78 172
Total Deferred Tax Assets 5,341 5,871
Valuation Allowance (79) (181)
Deferred Tax Assets, Net of Valuation Allowance 5,262 5,690
Deferred Tax Liabilities
Financial statement deferred policy acquisition costs and reserves (943) (1,040)
Net unrealized gains on investments (842) (1,489)
Other depreciable and amortizable assets (229) (217)
Other (42) (47)
Total Deferred Tax Liabilities (2,056) (2,793)
Net Deferred Tax Asset $ 3,206 $ 2,897
The Company has recorded a deferred tax asset valuation allowance that is adequate to reduce the total deferred tax asset to an amount
that will more likely than not be realized. In assessing the need for a valuation allowance, management considered future taxable
temporary difference reversals, future taxable income exclusive of reversing temporary differences and carryovers, taxable income in
open carry back years and other tax planning strategies. From time to time, tax planning strategies could include holding a portion of
debt securities with market value losses until recovery, altering the level of tax exempt securities held, making investments which have
specific tax characteristics, and business considerations such as asset-liability matching. Management views such tax planning strategies
as prudent and feasible and would implement them, if necessary, to realize the deferred tax assets.