The Hartford 2015 Annual Report Download - page 33
Download and view the complete annual report
Please find page 33 of the 2015 The Hartford annual report below. You can navigate through the pages in the report by either clicking on the pages listed below, or by using the keyword search tool below to find specific information within the annual report.-
 1
1 -
2
-
3
-
4
-
5
-
6
-
7
-
8
-
9
-
10
-
11
-
12
-
13
-
14
-
15
-
16
-
17
-
18
-
19
-
20
-
21
-
22
-
 23
23 -
 24
24 -
 25
25 -
 26
26 -
 27
27 -
 28
28 -
 29
29 -
 30
30 -
 31
31 -
 32
32 -
 33
33 -
 34
34 -
 35
35 -
 36
36 -
 37
37 -
 38
38 -
 39
39 -
 40
40 -
 41
41 -
 42
42 -
 43
43 -
44
-
45
-
46
-
47
-
48
-
49
-
50
-
51
-
52
-
53
-
54
-
55
-
56
-
57
-
58
-
59
-
60
-
61
-
62
-
63
-
64
-
65
-
66
-
67
-
68
-
69
-
70
-
71
-
72
-
73
-
74
-
75
-
76
-
77
-
78
-
79
-
80
-
81
-
82
-
83
-
84
-
85
-
86
-
87
-
88
-
89
-
90
-
91
-
92
-
93
-
94
-
95
-
96
-
97
-
98
-
99
-
100
-
101
-
102
-
103
-
104
-
105
-
106
-
107
-
108
-
109
-
110
-
111
-
112
-
113
-
114
-
115
-
116
-
117
-
118
-
119
-
120
-
121
-
122
-
123
-
124
-
125
-
126
-
127
-
128
-
129
-
130
-
131
-
132
-
133
-
134
-
135
-
136
-
137
-
138
-
139
-
140
-
141
-
142
-
143
-
144
-
145
-
146
-
147
-
148
-
149
-
150
-
151
-
152
-
153
-
154
-
155
-
156
-
157
-
158
-
159
-
160
-
161
-
162
-
163
-
164
-
165
-
166
-
167
-
168
-
169
-
170
-
171
-
172
-
173
-
174
-
175
-
176
-
177
-
178
-
179
-
180
-
181
-
182
-
183
-
184
-
185
-
186
-
187
-
188
-
189
-
190
-
191
-
192
-
193
-
194
-
195
-
196
-
197
-
198
-
199
-
200
-
201
-
202
-
203
-
204
-
205
-
206
-
207
-
208
-
209
-
210
-
211
-
212
-
213
-
214
-
215
-
216
-
217
-
218
-
219
-
220
-
221
-
222
-
223
-
224
-
225
-
226
-
227
-
228
-
229
-
230
-
231
-
232
-
233
-
234
-
235
-
236
-
237
-
238
-
239
-
240
-
241
-
242
-
243
-
244
-
245
-
246
-
247
-
248
-
249
-
250
-
251
-
252
-
253
-
254
-
255
 |
 |

33
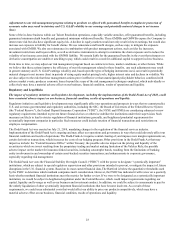
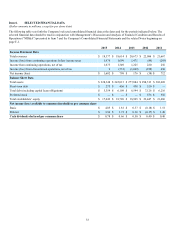
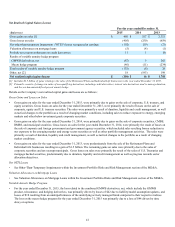
Item 6. SELECTED FINANCIAL DATA
(Dollar amounts in millions, except for per share data)
The following table sets forth the Company's selected consolidated financial data at the dates and for the periods indicated below. The
selected financial data should be read in conjunction with Management’s Discussion and Analysis of Financial Condition and Results of
Operations ("MD&A") presented in Item 7 and the Company's Consolidated Financial Statements and the related Notes beginning on
page F-1.
2015 2014 2013 2012 2011
Income Statement Data
Total revenues $ 18,377 $ 18,614 $ 20,673 $ 22,086 $ 21,667
Income (loss) from continuing operations before income taxes 1,978 1,699 1,471 (89) (293)
Income from continuing operations, net of tax 1,673 1,349 1,225 220 256
Income (loss) from discontinued operations, net of tax 9 (551)(1,049)(258) 456
Net income (loss) $ 1,682 $ 798 $ 176 $ (38) $ 712
Balance Sheet Data
Total assets $ 228,348 $ 245,013 $ 277,884 $ 298,513 $ 302,609
Short-term debt $ 275 $ 456 $ 438 $ 320 $ —
Total debt (including capital lease obligations) $ 5,359 $ 6,109 $ 6,544 $ 7,126 $ 6,216
Preferred stock $ — $ — $ — $ 556 $ 556
Total stockholders’ equity $ 17,642 $ 18,720 $ 18,905 $ 22,447 $ 21,486
Net income (loss) available to common shareholders per common share
Basic $ 4.05 $ 1.81 $ 0.37 $ (0.18) $ 1.51
Diluted $ 3.96 $ 1.73 $ 0.36 $ (0.17) $ 1.40
Cash dividends declared per common share $ 0.78 $ 0.66 $ 0.50 $ 0.40 $ 0.40