The Hartford 2015 Annual Report Download - page 39
Download and view the complete annual report
Please find page 39 of the 2015 The Hartford annual report below. You can navigate through the pages in the report by either clicking on the pages listed below, or by using the keyword search tool below to find specific information within the annual report.-
 1
1 -
2
-
3
-
4
-
5
-
6
-
7
-
8
-
9
-
10
-
11
-
12
-
13
-
14
-
15
-
16
-
17
-
18
-
19
-
20
-
21
-
22
-
23
-
24
-
25
-
26
-
27
-
28
-
 29
29 -
 30
30 -
 31
31 -
 32
32 -
 33
33 -
 34
34 -
 35
35 -
 36
36 -
 37
37 -
 38
38 -
 39
39 -
 40
40 -
 41
41 -
 42
42 -
 43
43 -
 44
44 -
 45
45 -
 46
46 -
 47
47 -
 48
48 -
 49
49 -
50
-
51
-
52
-
53
-
54
-
55
-
56
-
57
-
58
-
59
-
60
-
61
-
62
-
63
-
64
-
65
-
66
-
67
-
68
-
69
-
70
-
71
-
72
-
73
-
74
-
75
-
76
-
77
-
78
-
79
-
80
-
81
-
82
-
83
-
84
-
85
-
86
-
87
-
88
-
89
-
90
-
91
-
92
-
93
-
94
-
95
-
96
-
97
-
98
-
99
-
100
-
101
-
102
-
103
-
104
-
105
-
106
-
107
-
108
-
109
-
110
-
111
-
112
-
113
-
114
-
115
-
116
-
117
-
118
-
119
-
120
-
121
-
122
-
123
-
124
-
125
-
126
-
127
-
128
-
129
-
130
-
131
-
132
-
133
-
134
-
135
-
136
-
137
-
138
-
139
-
140
-
141
-
142
-
143
-
144
-
145
-
146
-
147
-
148
-
149
-
150
-
151
-
152
-
153
-
154
-
155
-
156
-
157
-
158
-
159
-
160
-
161
-
162
-
163
-
164
-
165
-
166
-
167
-
168
-
169
-
170
-
171
-
172
-
173
-
174
-
175
-
176
-
177
-
178
-
179
-
180
-
181
-
182
-
183
-
184
-
185
-
186
-
187
-
188
-
189
-
190
-
191
-
192
-
193
-
194
-
195
-
196
-
197
-
198
-
199
-
200
-
201
-
202
-
203
-
204
-
205
-
206
-
207
-
208
-
209
-
210
-
211
-
212
-
213
-
214
-
215
-
216
-
217
-
218
-
219
-
220
-
221
-
222
-
223
-
224
-
225
-
226
-
227
-
228
-
229
-
230
-
231
-
232
-
233
-
234
-
235
-
236
-
237
-
238
-
239
-
240
-
241
-
242
-
243
-
244
-
245
-
246
-
247
-
248
-
249
-
250
-
251
-
252
-
253
-
254
-
255
 |
 |

39
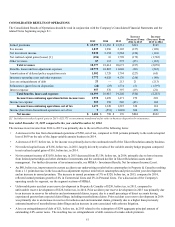
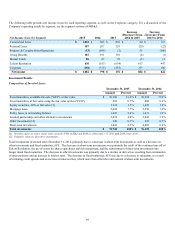
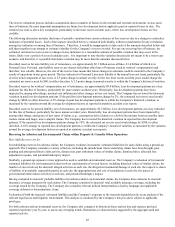
The following table presents net income (loss) for each reporting segment, as well as the Corporate category. For a discussion of the
Company's operating results by segment, see the segment sections of MD&A.
Net Income (Loss) by Segment 2015 2014 2013
Increase
(Decrease) From
2014 to 2015
Increase
(Decrease) From
2013 to 2014
Commercial Lines $ 1,003 $ 983 $ 870 $ 20 $ 113
Personal Lines 187 207 229 (20) (22)
Property & Casualty Other Operations (53)(108)(2) 55 (106)
Group Benefits 187 191 192 (4) (1)
Mutual Funds 86 87 76 (1) 11
Talcott Resolution 430 (187)(634) 617 447
Corporate (158)(375)(555) 217 180
Net income $ 1,682 $ 798 $ 176 $ 884 $ 622
Investment Results
Composition of Invested Assets
December 31, 2015 December 31, 2014
Amount Percent Amount Percent
Fixed maturities, available-for-sale ("AFS"), at fair value $ 59,196 81.4 % $ 59,384 77.9 %
Fixed maturities, at fair value using the fair value option ("FVO") 503 0.7 % 488 0.6 %
Equity securities, AFS, at fair value [1] 1,121 1.5 % 1,047 1.4 %
Mortgage loans 5,624 7.7 % 5,556 7.3 %
Policy loans, at outstanding balance 1,447 2.0 % 1,431 1.9 %
Limited partnerships and other alternative investments 2,874 4.0 % 2,942 3.9 %
Other investments [2] 120 0.2 % 547 0.7 %
Short-term investments 1,843 2.5 % 4,883 6.4 %
Total investments $ 72,728 100% $ 76,278 100%
[1] Includes equity securities at fair value using the FVO of $282 and $348 as of December 31, 2015 and 2014, respectively.
[2] Primarily relates to derivative instruments.
Total investments decreased since December 31, 2014, primarily due to a decrease in short-term investments as well as a decrease in
other investments and fixed maturities, AFS. The decrease in short-term investments was primarily the result of the continued run-off of
Talcott Resolution, the use of assets for share repurchases and debt repayment, and the reinvestment of short-term investments into
longer dated fixed maturities. The decrease in other investments was primarily due to a decline in derivatives resulting from termination
of open positions and an increase in interest rates. The decrease in fixed maturities, AFS was due to a decrease in valuations as a result
of widening credit spreads and an increase in interest rates, which more than offset the reinvestment of short-term investments.