The Hartford 2015 Annual Report Download - page 233
Download and view the complete annual report
Please find page 233 of the 2015 The Hartford annual report below. You can navigate through the pages in the report by either clicking on the pages listed below, or by using the keyword search tool below to find specific information within the annual report.-
 1
1 -
2
-
3
-
4
-
5
-
6
-
7
-
8
-
9
-
10
-
11
-
12
-
13
-
14
-
15
-
16
-
17
-
18
-
19
-
20
-
21
-
22
-
23
-
24
-
25
-
26
-
27
-
28
-
29
-
30
-
31
-
32
-
33
-
34
-
35
-
36
-
37
-
38
-
39
-
40
-
41
-
42
-
43
-
44
-
45
-
46
-
47
-
48
-
49
-
50
-
51
-
52
-
53
-
54
-
55
-
56
-
57
-
58
-
59
-
60
-
61
-
62
-
63
-
64
-
65
-
66
-
67
-
68
-
69
-
70
-
71
-
72
-
73
-
74
-
75
-
76
-
77
-
78
-
79
-
80
-
81
-
82
-
83
-
84
-
85
-
86
-
87
-
88
-
89
-
90
-
91
-
92
-
93
-
94
-
95
-
96
-
97
-
98
-
99
-
100
-
101
-
102
-
103
-
104
-
105
-
106
-
107
-
108
-
109
-
110
-
111
-
112
-
113
-
114
-
115
-
116
-
117
-
118
-
119
-
120
-
121
-
122
-
123
-
124
-
125
-
126
-
127
-
128
-
129
-
130
-
131
-
132
-
133
-
134
-
135
-
136
-
137
-
138
-
139
-
140
-
141
-
142
-
143
-
144
-
145
-
146
-
147
-
148
-
149
-
150
-
151
-
152
-
153
-
154
-
155
-
156
-
157
-
158
-
159
-
160
-
161
-
162
-
163
-
164
-
165
-
166
-
167
-
168
-
169
-
170
-
171
-
172
-
173
-
174
-
175
-
176
-
177
-
178
-
179
-
180
-
181
-
182
-
183
-
184
-
185
-
186
-
187
-
188
-
189
-
190
-
191
-
192
-
193
-
194
-
195
-
196
-
197
-
198
-
199
-
200
-
201
-
202
-
203
-
204
-
205
-
206
-
207
-
208
-
209
-
210
-
211
-
212
-
213
-
214
-
215
-
216
-
217
-
218
-
219
-
220
-
221
-
222
-
 223
223 -
 224
224 -
 225
225 -
 226
226 -
 227
227 -
 228
228 -
 229
229 -
 230
230 -
 231
231 -
 232
232 -
 233
233 -
 234
234 -
 235
235 -
 236
236 -
 237
237 -
 238
238 -
 239
239 -
 240
240 -
 241
241 -
 242
242 -
 243
243 -
244
-
245
-
246
-
247
-
248
-
249
-
250
-
251
-
252
-
253
-
254
-
255
 |
 |

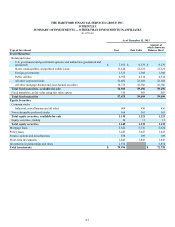
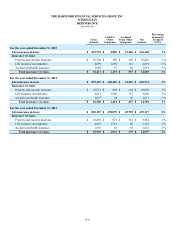
S-1
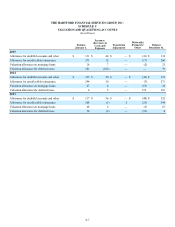
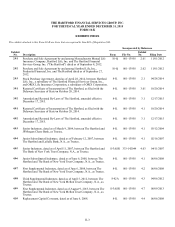
THE HARTFORD FINANCIAL SERVICES GROUP, INC.
SCHEDULE I
SUMMARY OF INVESTMENTS — OTHER THAN INVESTMENTS IN AFFILIATES
(In millions)
As of December 31, 2015
Type of Investment Cost Fair Value
Amount at
which shown on
Balance Sheet
Fixed Maturities
Bonds and notes
U.S. government and government agencies and authorities (guaranteed and
sponsored) $ 7,911 $ 8,179 $ 8,179
States, municipalities and political subdivisions 11,124 12,121 12,121
Foreign governments 1,321 1,308 1,308
Public utilities 4,395 4,634 4,634
All other corporate bonds 21,481 22,168 22,168
All other mortgage-backed and asset-backed securities 10,733 10,786 10,786
Total fixed maturities, available-for-sale 56,965 59,196 59,196
Fixed maturities, at fair value using fair value option 510 503 503
Total fixed maturities 57,475 59,699 59,699
Equity Securities
Common stocks
Industrial, miscellaneous and all other 969 956 956
Non-redeemable preferred stocks 166 165 165
Total equity securities, available-for-sale 1,135 1,121 1,121
Equity securities, trading 10 11 11
Total equity securities 1,145 1,132 1,132
Mortgage loans 5,624 5,736 5,624
Policy loans 1,447 1,447 1,447
Futures, options and miscellaneous 588 109 109
Short-term investments 1,843 1,843 1,843
Investments in partnerships and trusts 2,874 2,874
Total investments $ 70,996 $ 72,728