The Hartford 2015 Annual Report Download - page 152
Download and view the complete annual report
Please find page 152 of the 2015 The Hartford annual report below. You can navigate through the pages in the report by either clicking on the pages listed below, or by using the keyword search tool below to find specific information within the annual report.-
 1
1 -
2
-
3
-
4
-
5
-
6
-
7
-
8
-
9
-
10
-
11
-
12
-
13
-
14
-
15
-
16
-
17
-
18
-
19
-
20
-
21
-
22
-
23
-
24
-
25
-
26
-
27
-
28
-
29
-
30
-
31
-
32
-
33
-
34
-
35
-
36
-
37
-
38
-
39
-
40
-
41
-
42
-
43
-
44
-
45
-
46
-
47
-
48
-
49
-
50
-
51
-
52
-
53
-
54
-
55
-
56
-
57
-
58
-
59
-
60
-
61
-
62
-
63
-
64
-
65
-
66
-
67
-
68
-
69
-
70
-
71
-
72
-
73
-
74
-
75
-
76
-
77
-
78
-
79
-
80
-
81
-
82
-
83
-
84
-
85
-
86
-
87
-
88
-
89
-
90
-
91
-
92
-
93
-
94
-
95
-
96
-
97
-
98
-
99
-
100
-
101
-
102
-
103
-
104
-
105
-
106
-
107
-
108
-
109
-
110
-
111
-
112
-
113
-
114
-
115
-
116
-
117
-
118
-
119
-
120
-
121
-
122
-
123
-
124
-
125
-
126
-
127
-
128
-
129
-
130
-
131
-
132
-
133
-
134
-
135
-
136
-
137
-
138
-
139
-
140
-
141
-
 142
142 -
 143
143 -
 144
144 -
 145
145 -
 146
146 -
 147
147 -
 148
148 -
 149
149 -
 150
150 -
 151
151 -
 152
152 -
 153
153 -
 154
154 -
 155
155 -
 156
156 -
 157
157 -
 158
158 -
 159
159 -
 160
160 -
 161
161 -
 162
162 -
163
-
164
-
165
-
166
-
167
-
168
-
169
-
170
-
171
-
172
-
173
-
174
-
175
-
176
-
177
-
178
-
179
-
180
-
181
-
182
-
183
-
184
-
185
-
186
-
187
-
188
-
189
-
190
-
191
-
192
-
193
-
194
-
195
-
196
-
197
-
198
-
199
-
200
-
201
-
202
-
203
-
204
-
205
-
206
-
207
-
208
-
209
-
210
-
211
-
212
-
213
-
214
-
215
-
216
-
217
-
218
-
219
-
220
-
221
-
222
-
223
-
224
-
225
-
226
-
227
-
228
-
229
-
230
-
231
-
232
-
233
-
234
-
235
-
236
-
237
-
238
-
239
-
240
-
241
-
242
-
243
-
244
-
245
-
246
-
247
-
248
-
249
-
250
-
251
-
252
-
253
-
254
-
255
 |
 |

Table of Contents THE HARTFORD FINANCIAL SERVICES GROUP, INC.
NOTES TO CONSOLIDATED FINANCIAL STATEMENTS (continued)
3. Segment Information (continued)
F-21
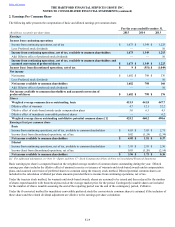
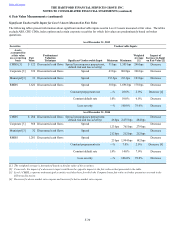
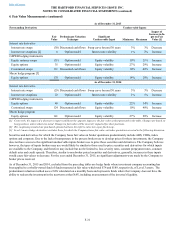
The following table presents revenues by product line for each reporting segment, as well as the Corporate category.
For the years ended December 31,
Revenues 2015 2014 2013
Earned premiums and fee income
Commercial Lines
Workers’ compensation $ 3,051 $ 2,971 $ 2,975
Property 637 559 521
Automobile 614 591 579
Package business 1,203 1,163 1,139
Liability 567 582 566
Bond 218 210 201
Professional liability 221 213 222
Total Commercial Lines 6,511 6,289 6,203
Personal Lines
Automobile 2,671 2,613 2,522
Homeowners 1,202 1,193 1,138
Total Personal Lines [1] 3,873 3,806 3,660
Property & Casualty Other Operations 32 1 1
Group Benefits
Group disability 1,479 1,450 1,452
Group life 1,477 1,478 1,717
Other 180 167 161
Total Group Benefits 3,136 3,095 3,330
Mutual Funds
Mutual Fund 607 586 520
Talcott 116 137 148
Total Mutual Funds 723 723 668
Talcott Resolution 1,133 1,407 1,463
Corporate 8 11 11
Total earned premiums and fee income 15,416 15,332 15,336
Net investment income:
Securities available-for-sale and other 3,030 3,153 3,263
Equity securities, trading — 1 1
Total net investment income 3,030 3,154 3,264
Net realized capital gains (loss) (156) 16 1,798
Other revenues 87 112 275
Total revenues $ 18,377 $ 18,614 $ 20,673
[1] For 2015, 2014 and 2013, AARP members accounted for earned premiums of $3.2 billion, $3.0 billion and $2.9 billion, respectively.
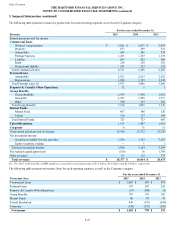
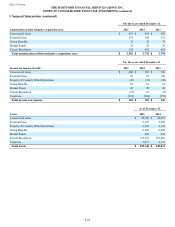
The following table presents net income (loss) for each reporting segment, as well as the Corporate category.
For the years ended December 31,
Net income (loss) 2015 2014 2013
Commercial Lines $ 1,003 $ 983 $ 870
Personal Lines 187 207 229
Property & Casualty Other Operations (53)(108) (2)
Group Benefits 187 191 192
Mutual Funds 86 87 76
Talcott Resolution 430 (187) (634)
Corporate (158)(375) (555)
Net income $ 1,682 $ 798 $ 176