The Hartford 2015 Annual Report Download - page 37
Download and view the complete annual report
Please find page 37 of the 2015 The Hartford annual report below. You can navigate through the pages in the report by either clicking on the pages listed below, or by using the keyword search tool below to find specific information within the annual report.-
 1
1 -
2
-
3
-
4
-
5
-
6
-
7
-
8
-
9
-
10
-
11
-
12
-
13
-
14
-
15
-
16
-
17
-
18
-
19
-
20
-
21
-
22
-
23
-
24
-
25
-
26
-
 27
27 -
 28
28 -
 29
29 -
 30
30 -
 31
31 -
 32
32 -
 33
33 -
 34
34 -
 35
35 -
 36
36 -
 37
37 -
 38
38 -
 39
39 -
 40
40 -
 41
41 -
 42
42 -
 43
43 -
 44
44 -
 45
45 -
 46
46 -
 47
47 -
48
-
49
-
50
-
51
-
52
-
53
-
54
-
55
-
56
-
57
-
58
-
59
-
60
-
61
-
62
-
63
-
64
-
65
-
66
-
67
-
68
-
69
-
70
-
71
-
72
-
73
-
74
-
75
-
76
-
77
-
78
-
79
-
80
-
81
-
82
-
83
-
84
-
85
-
86
-
87
-
88
-
89
-
90
-
91
-
92
-
93
-
94
-
95
-
96
-
97
-
98
-
99
-
100
-
101
-
102
-
103
-
104
-
105
-
106
-
107
-
108
-
109
-
110
-
111
-
112
-
113
-
114
-
115
-
116
-
117
-
118
-
119
-
120
-
121
-
122
-
123
-
124
-
125
-
126
-
127
-
128
-
129
-
130
-
131
-
132
-
133
-
134
-
135
-
136
-
137
-
138
-
139
-
140
-
141
-
142
-
143
-
144
-
145
-
146
-
147
-
148
-
149
-
150
-
151
-
152
-
153
-
154
-
155
-
156
-
157
-
158
-
159
-
160
-
161
-
162
-
163
-
164
-
165
-
166
-
167
-
168
-
169
-
170
-
171
-
172
-
173
-
174
-
175
-
176
-
177
-
178
-
179
-
180
-
181
-
182
-
183
-
184
-
185
-
186
-
187
-
188
-
189
-
190
-
191
-
192
-
193
-
194
-
195
-
196
-
197
-
198
-
199
-
200
-
201
-
202
-
203
-
204
-
205
-
206
-
207
-
208
-
209
-
210
-
211
-
212
-
213
-
214
-
215
-
216
-
217
-
218
-
219
-
220
-
221
-
222
-
223
-
224
-
225
-
226
-
227
-
228
-
229
-
230
-
231
-
232
-
233
-
234
-
235
-
236
-
237
-
238
-
239
-
240
-
241
-
242
-
243
-
244
-
245
-
246
-
247
-
248
-
249
-
250
-
251
-
252
-
253
-
254
-
255
 |
 |

37
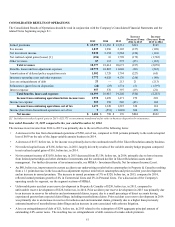
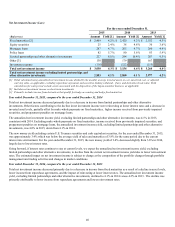
CONSOLIDATED RESULTS OF OPERATIONS
The Consolidated Results of Operations should be read in conjunction with the Company's Consolidated Financial Statements and the
related Notes beginning on page F-1.
2015 2014 2013
Increase
(Decrease) From
2014 to 2015
Increase
(Decrease) From
2013 to 2014
Earned premiums $ 13,577 $ 13,336 $ 13,231 $241 $105
Fee income 1,839 1,996 2,105 (157) (109)
Net investment income 3,030 3,154 3,264 (124) (110)
Net realized capital gains (losses) [1] (156)16 1,798 (172) (1,782)
Other revenues 87 112 275 (25) (163)
Total revenues 18,377 18,614 20,673 (237) (2,059)
Benefits, losses and loss adjustment expenses 10,775 10,805 11,048 (30) (243)
Amortization of deferred policy acquisition costs 1,502 1,729 1,794 (227) (65)
Insurance operating costs and other expenses 3,772 4,028 4,176 (256) (148)
Loss on extinguishment of debt 21 — 213 21 (213)
Reinsurance (gain) loss on disposition (28)(23) 1,574 (5) (1,597)
Interest expense 357 376 397 (19) (21)
Total benefits, losses and expenses 16,399 16,915 19,202 (516) (2,287)
Income from continuing operations before income taxes 1,978 1,699 1,471 279 228
Income tax expense 305 350 246 (45) 104
Income from continuing operations, net of tax 1,673 1,349 1,225 324 124
Income (loss) from discontinued operations, net of tax 9(551)(1,049) 560 498
Net income $ 1,682 $ 798 $ 176 $884 $622
[1] Includes net realized capital gains in 2013 of $1,575 on investments transferred at fair value in business disposition by reinsurance.
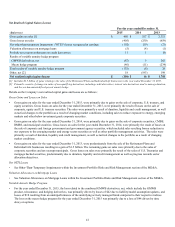
Year ended December 31, 2015 compared to the year ended December 31, 2014
The increase in net income from 2014 to 2015 was primarily due to the net effect of the following items:
• A decrease in the loss from discontinued operations of $560, net of tax, compared to 2014 pertains primarily to the realized capital
loss of $659 on the sale of the Japan variable annuity business in 2014.
• A decrease of $157, before tax, in fee income was primarily due to the continued runoff of the Talcott Resolution annuity business.
• Net realized capital losses of $156, before tax, in 2015, largely driven by results of the variable annuity hedge program compared
to net realized capital gains of $16, before tax, in 2014.
• Net investment income of $3,030, before tax, in 2015 decreased from $3,154, before tax, in 2014, primarily due to lower income
from limited partnerships and other alternative investments and the continued decline in Talcott Resolution assets under
management. For further discussion of investment results, see MD&A - Investment Results, Net Investment Income (Loss).
• An $80, before tax, improvement in current accident year underwriting results before catastrophes in Property & Casualty resulting
from a 1.1 point decrease in the loss and loss adjustment expense ratio before catastrophes and prior accident year development
and an increase in earned premium. The increase in earned premiums of 3% or $320, before tax, in 2015, compared to 2014,
reflected earned premium growth of 4% in Commercial Lines and 2% in Personal Lines. For a discussion of the Company's
operating results by segment, see the segment sections of MD&A.
• Unfavorable prior accident year reserve development in Property & Casualty of $250, before tax, in 2015, compared to
unfavorable reserve development of $228, before tax, in 2014. Prior accident year reserve development in 2015 was primarily due
to an increase in reserves for asbestos and environmental claims, in part, due to a small percentage of direct accounts having
experienced greater than expected claim filings, including mesothelioma claims. Prior accident year reserve development in 2014
was primarily due to an increase in reserves for asbestos and environmental claims, primarily due to a higher than previously
estimated number of mesothelioma claim filings and an increase in costs associated with asbestos litigation.
• A loss on extinguishment of debt of $21, before tax, in 2015 related to the redemption of $296 aggregate principal amount of
outstanding 4.0% senior notes. The resulting loss on extinguishment of debt consists of a make-whole premium.