ICICI Bank 2008 Annual Report Download - page 94
Download and view the complete annual report
Please find page 94 of the 2008 ICICI Bank annual report below. You can navigate through the pages in the report by either clicking on the pages listed below, or by using the keyword search tool below to find specific information within the annual report.-
 1
1 -
2
-
3
-
4
-
5
-
6
-
7
-
8
-
9
-
10
-
11
-
12
-
13
-
14
-
15
-
16
-
17
-
18
-
19
-
20
-
21
-
22
-
23
-
24
-
25
-
26
-
27
-
28
-
29
-
30
-
31
-
32
-
33
-
34
-
35
-
36
-
37
-
38
-
39
-
40
-
41
-
42
-
43
-
44
-
45
-
46
-
47
-
48
-
49
-
50
-
51
-
52
-
53
-
54
-
55
-
56
-
57
-
58
-
59
-
60
-
61
-
62
-
63
-
64
-
65
-
66
-
67
-
68
-
69
-
70
-
71
-
72
-
73
-
74
-
75
-
76
-
77
-
78
-
79
-
80
-
81
-
82
-
83
-
 84
84 -
 85
85 -
 86
86 -
 87
87 -
 88
88 -
 89
89 -
 90
90 -
 91
91 -
 92
92 -
 93
93 -
 94
94 -
 95
95 -
 96
96 -
 97
97 -
 98
98 -
 99
99 -
 100
100 -
 101
101 -
 102
102 -
 103
103 -
 104
104 -
105
-
106
-
107
-
108
-
109
-
110
-
111
-
112
-
113
-
114
-
115
-
116
-
117
-
118
-
119
-
120
-
121
-
122
-
123
-
124
-
125
-
126
-
127
-
128
-
129
-
130
-
131
-
132
-
133
-
134
-
135
-
136
-
137
-
138
-
139
-
140
-
141
-
142
-
143
-
144
-
145
-
146
-
147
-
148
-
149
-
150
-
151
-
152
-
153
-
154
-
155
-
156
-
157
-
158
-
159
-
160
-
161
-
162
-
163
-
164
-
165
-
166
-
167
-
168
-
169
-
170
-
171
-
172
-
173
-
174
-
175
-
176
-
177
-
178
-
179
-
180
-
181
-
182
-
183
-
184
-
185
-
186
-
187
-
188
 |
 |

F20
schedules
forming part of the Accounts (Contd.)
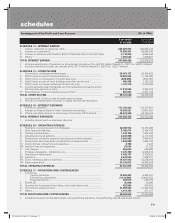
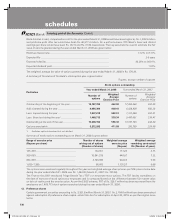
Inter-segment transactions were generally based on transfer pricing measures as determined by management. Income,
expenses, assets and liabilities were either specifically identified with individual segments or are allocated to segments on
a systematic basis.
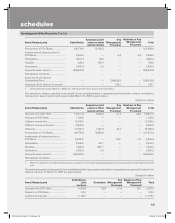
The business segment results on this basis are given below: Rupees in million
For the year ended March 31, 2007
Particulars Consumer and
commercial banking
Investment
Banking Total
1. Revenue ................................................................................. 234,793.7 70,662.0 305,455.7
2. Less: Inter-segment revenue ................................................. (16,221.1)
3. Total revenue (1) – (2) ............................................................. 289,234.6
4. Segment results .................................................................... 23,383.9 13,480.5 36,864.4
5. Unallocated expenses ............................................................ 384.0
6. Income tax expenses (net of deferred tax credit) .................. 5,378.2
7. Net Profit (4) – (5) – (6) ......................................................... 31,102.2
8. Segment assets ..................................................................... 2,163,604.5 1,238,714.1 3,402,318.6
9. Unallocated assets1 ................................................................ 44,262.5
10. Total assets (8) + (9) ............................................................ 3,446,581.1
11. Segment liabilities ................................................................. 2,642,032.9 804,548.223,446,581.1
12. Unallocated liabilities ............................................................. —
13. Total liabilities (11) + (12) .................................................... 3,446,581.1
1. Includes tax paid in advance/tax deducted at source (net), deferred tax asset (net) and early retirement option expenses not written
off.
2. Includes share capital and reserves and surplus.
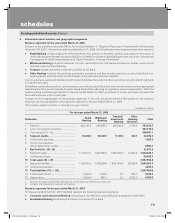
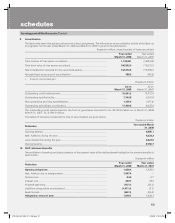
Geographical segments
The Bank reports its operations under the following geographical segments.
l Domestic operations comprises branches having operations in India.
l Foreign operations comprises branches having operations outside India and offshore banking unit having operations
in India.
Geographical segment results are given below:
Rupees in million
Revenue1For the year ended
March 31, 2008
For the year ended
March 31, 2007
Domestic Operation ...................................................................................... 362,828.2 268,961.9
Foreign Operation ......................................................................................... 33,162.9 20,272.7
Total .............................................................................................................. 395,991.1 289,234.6
1. Gains and losses on offsetting transactions are accounted for separately in domestic and foreign segments respectively
and not netted off. Rupees in million
Assets As on
March 31, 2008 As on
March 31, 2007
Domestic Operation ...................................................................................... 3,329,664.8 3,039,670.0
Foreign Operation ......................................................................................... 614,743.3 406,911.1
Total .............................................................................................................. 3,944,408.1 3,446,581.1
ICICI_BK_AR_2008_(F1_F46).indd 20ICICI_BK_AR_2008_(F1_F46).indd 20 6/20/08 3:24:54 PM6/20/08 3:24:54 PM