ICICI Bank 2008 Annual Report Download - page 126
Download and view the complete annual report
Please find page 126 of the 2008 ICICI Bank annual report below. You can navigate through the pages in the report by either clicking on the pages listed below, or by using the keyword search tool below to find specific information within the annual report.-
 1
1 -
2
-
3
-
4
-
5
-
6
-
7
-
8
-
9
-
10
-
11
-
12
-
13
-
14
-
15
-
16
-
17
-
18
-
19
-
20
-
21
-
22
-
23
-
24
-
25
-
26
-
27
-
28
-
29
-
30
-
31
-
32
-
33
-
34
-
35
-
36
-
37
-
38
-
39
-
40
-
41
-
42
-
43
-
44
-
45
-
46
-
47
-
48
-
49
-
50
-
51
-
52
-
53
-
54
-
55
-
56
-
57
-
58
-
59
-
60
-
61
-
62
-
63
-
64
-
65
-
66
-
67
-
68
-
69
-
70
-
71
-
72
-
73
-
74
-
75
-
76
-
77
-
78
-
79
-
80
-
81
-
82
-
83
-
84
-
85
-
86
-
87
-
88
-
89
-
90
-
91
-
92
-
93
-
94
-
95
-
96
-
97
-
98
-
99
-
100
-
101
-
102
-
103
-
104
-
105
-
106
-
107
-
108
-
109
-
110
-
111
-
112
-
113
-
114
-
115
-
 116
116 -
 117
117 -
 118
118 -
 119
119 -
 120
120 -
 121
121 -
 122
122 -
 123
123 -
 124
124 -
 125
125 -
 126
126 -
 127
127 -
 128
128 -
 129
129 -
 130
130 -
 131
131 -
 132
132 -
 133
133 -
 134
134 -
 135
135 -
 136
136 -
137
-
138
-
139
-
140
-
141
-
142
-
143
-
144
-
145
-
146
-
147
-
148
-
149
-
150
-
151
-
152
-
153
-
154
-
155
-
156
-
157
-
158
-
159
-
160
-
161
-
162
-
163
-
164
-
165
-
166
-
167
-
168
-
169
-
170
-
171
-
172
-
173
-
174
-
175
-
176
-
177
-
178
-
179
-
180
-
181
-
182
-
183
-
184
-
185
-
186
-
187
-
188
 |
 |

F52
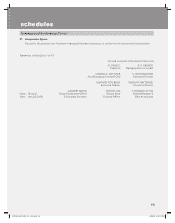
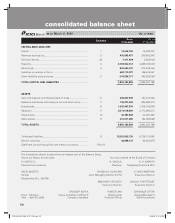
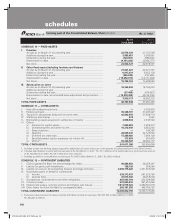
Significant Accounting Policies and Notes to Accounts (refer Schedule 18 & 19).
The Schedules referred to above form an integral part of the consolidated balance sheet
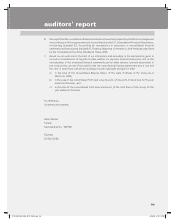
As per our Report of even date For and on behalf of the Board of Directors
For BSR & Co. N. VAGHUL K. V. KAMATH
Chartered Accountants Chairman Managing Director & CEO
AKEEL MASTER CHANDA D. KOCHHAR V. VAIDYANATHAN
Partner Joint Managing Director & CFO Executive Director
Membership No.: 046768
MADHABI PURI BUCH SONJOY CHATTERJEE
Executive Director Executive Director
SANDEEP BATRA RAKESH JHA CHARANJIT ATTRA
Place : Mumbai Group Compliance Officer & Deputy Chief General Manager &
Date : April 26, 2008 Company Secretary Financial Officer Chief Accountant
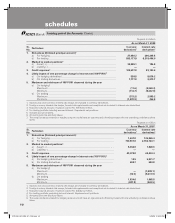
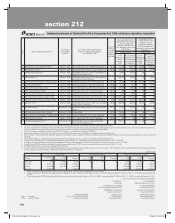
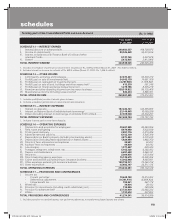
consolidated cash flow statement
for the year ended March 31, 2008
Particulars Year ended Year ended
31.03.2008 31.03.2007
(Rs. in ‘000s)
Cash flow from operating activities
Net profit before taxes ............................................................................ 45,079,134 35,247,100
Adjustments for: ....................................................................................
Depreciation and amortisation ................................................................ 8,721,642 8,346,161
Net (appreciation)/depreciation on investments..................................... 14,493,875 12,160,982
Provision in respect of non-performing assets (including prudential
provision on standard assets) ................................................................. 27,723,909 22,082,234
Provision for contingencies & others ...................................................... 1,723,502 307,652
(Profit)/loss on sale of fixed assets ......................................................... (613,379) (351,246)
97,128,683 77,792,883
Adjustments for: ....................................................................................
(Increase)/decrease in investments ........................................................ (132,276,092) (173,187,373)
(Increase)/decrease in advances ............................................................. (423,725,121) (565,891,731)
Increase/(decrease) in borrowings .......................................................... 100,659,704 96,294,679
Increase/(decrease) in deposits .............................................................. 270,566,682 761,626,500
(Increase)/decrease in other assets ........................................................ (40,067,589) (27,065,243)
Increase/(decrease) in other liabilities and provisions ............................ 173,249,913 111,407,820
(51,592,503) 203,184,652
(Payment)/refund of taxes (net) ............................................................... (23,865,900) (21,192,739)
Net cash flow from operating activities .............................................. (A) 21,670,280 259,784,796
Cash flow from investing activities ......................................................
Purchase of fixed assets ......................................................................... (13,779,728) (8,652,868)
Proceeds from sale of fixed assets ........................................................ 1,100,906 1,759,850
(Purchase)/sale of held to maturity securities ........................................ (278,393,897) (204,006,388)
Net cash generated from investing activities...................................... (B) (291,072,719) (210,899,407)
Cash flow from financing activities ......................................................
Proceeds from issue of share capital (including ESOPs) net of issue expense 197,945,383 2,055,383
Net proceeds/(repayment) of bonds (including subordinated debts) .... 138,335,874 172,962,927
Dividend and dividend tax paid ............................................................... (11,124,591) (9,072,081)
Net cash generated from financing activities...................................... (C) 325,156,666 165,946,229
Effect of exchange fluctuation on translation reserve....................... . (D) (1,721,319) (491,265)
Net cash and cash equivalents received from The Sangli Bank Limited
on amalgamation ................................................................................... (E) 2,362,563 —
Net increase/(decrease) in cash and cash equivalents ............. (A) + (B) + (C) + (D) + (E) 56,395,471 214,340,353
Cash and cash equivalents as at April 1 .............................................. 396,891,302 182,550,949
Cash and cash equivalents as at March 31 .......................................... 453,286,773 396,891,302
ICICI_BK_AR_2008_(F47_F92).indd 52ICICI_BK_AR_2008_(F47_F92).indd 52 6/20/08 3:31:30 PM6/20/08 3:31:30 PM