ICICI Bank 2008 Annual Report Download - page 54
Download and view the complete annual report
Please find page 54 of the 2008 ICICI Bank annual report below. You can navigate through the pages in the report by either clicking on the pages listed below, or by using the keyword search tool below to find specific information within the annual report.-
 1
1 -
2
-
3
-
4
-
5
-
6
-
7
-
8
-
9
-
10
-
11
-
12
-
13
-
14
-
15
-
16
-
17
-
18
-
19
-
20
-
21
-
22
-
23
-
24
-
25
-
26
-
27
-
28
-
29
-
30
-
31
-
32
-
33
-
34
-
35
-
36
-
37
-
38
-
39
-
40
-
41
-
42
-
43
-
 44
44 -
 45
45 -
 46
46 -
 47
47 -
 48
48 -
 49
49 -
 50
50 -
 51
51 -
 52
52 -
 53
53 -
 54
54 -
 55
55 -
 56
56 -
 57
57 -
 58
58 -
 59
59 -
 60
60 -
 61
61 -
 62
62 -
 63
63 -
 64
64 -
65
-
66
-
67
-
68
-
69
-
70
-
71
-
72
-
73
-
74
-
75
-
76
-
77
-
78
-
79
-
80
-
81
-
82
-
83
-
84
-
85
-
86
-
87
-
88
-
89
-
90
-
91
-
92
-
93
-
94
-
95
-
96
-
97
-
98
-
99
-
100
-
101
-
102
-
103
-
104
-
105
-
106
-
107
-
108
-
109
-
110
-
111
-
112
-
113
-
114
-
115
-
116
-
117
-
118
-
119
-
120
-
121
-
122
-
123
-
124
-
125
-
126
-
127
-
128
-
129
-
130
-
131
-
132
-
133
-
134
-
135
-
136
-
137
-
138
-
139
-
140
-
141
-
142
-
143
-
144
-
145
-
146
-
147
-
148
-
149
-
150
-
151
-
152
-
153
-
154
-
155
-
156
-
157
-
158
-
159
-
160
-
161
-
162
-
163
-
164
-
165
-
166
-
167
-
168
-
169
-
170
-
171
-
172
-
173
-
174
-
175
-
176
-
177
-
178
-
179
-
180
-
181
-
182
-
183
-
184
-
185
-
186
-
187
-
188
 |
 |

Net interest margin is expected to continue to be lower than other banks in India until we increase the proportion
of low-cost deposits and retail deposits in our total funding. The net interest margin is also impacted by the
relatively lower net interest margin earned by our overseas branches, which is offset by the higher fee income
that we are able to earn by leveraging our international presence and our ability to meet the foreign currency
borrowing requirements of Indian companies.
Non-Interest Income
Fee income
Fee income increased by 32.2% to Rs. 66.27 billion in fiscal 2008 from Rs. 50.12 billion in fiscal 2007 primarily
due to growth in fee income from structuring and advisory fees, fees from international operations, third party
distribution fees and fee income from small enterprises. Fees include merchant foreign exchange income, margin
on customer derivative transactions and loan processing fees.
Treasury income
Treasury income decreased by 19.6% to Rs. 8.15 billion in fiscal 2008 from Rs. 10.14 billion in fiscal 2007 primarily
due to mark-to-market losses/realised losses of Rs. 6.85 billion on the credit derivatives portfolio, offset, in part
by higher gains from sale of equity and fixed income investments and proprietary trading.
As at March 31, 2008, the Bank had a portfolio of Rs. 62.80 billion, including funded investments of Rs. 12.23
billion, in various credit derivative instruments including credit default swaps (CDSs), credit linked notes (CLNs)
and collateralised debt obligations (CDOs). The majority of the underlying exposure is to Indian corporates. During
fiscal 2008, global credit markets experienced significant volatility, widening of spreads, substantial risk aversion
and tight liquidity. This resulted in a mark-to-market/realised loss of Rs. 6.85 billion on the credit derivative portfolio
during the year.
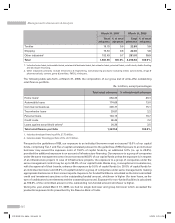
Lease & other income
Lease income decreased by 8.8% to Rs. 2.17 billion in fiscal 2008 from Rs. 2.38 billion in fiscal 2007 primarily due
to decrease in leased assets to Rs. 7.97 billion at year-end fiscal 2008 compared to Rs. 10.03 billion at year-end
fiscal 2007, since the Bank is not entering into new lease transactions.
Other income increased by 73.5% to Rs. 11.52 billion in fiscal 2008 compared to Rs. 6.64 billion in fiscal 2007
primarily due to increase in income by way of dividend from subsidiary companies and distribution from venture
capital funds.
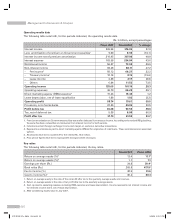
Non-interest expense
The following table sets forth, for the periods indicated, the principal components of non-interest expense.
Rs. in billion, except percentages
Fiscal 2007 Fiscal 2008 % change
Employee expenses 16.17 20.79 28.6
Depreciation on own property (including non banking assets) 3.57 3.96 10.9
Auditors’ fees and expenses 0.02 0.02 —
Other administrative expenses 30.03 39.52 31.6
Total non-interest expense (excluding lease depreciation and
direct marketing agency expenses) 49.79 64.29 29.1
Depreciation (net of lease equalisation) on leased assets 1.88 1.82 (3.2)
Direct marketing agency expenses 15.24 15.43 1.2
Total non-interest expense 66.91 81.54 21.9
1. All amounts have been rounded off to the nearest Rs. 10.0 million.
Total non-interest expense increased by 21.9% to Rs. 81.54 billion in fiscal 2008 from Rs. 66.91 billion in fiscal 2007
primarily due to a 28.6% increase in employee expenses and 31.6% increase in other administrative expenses.
Employee expenses increased by 28.6% to Rs. 20.79 billion in fiscal 2008 from Rs. 16.17 billion in fiscal 2007 primarily
due to a 22.1% increase in employee base and annual increase in salaries and other employee benefits.
Management’s Discussion & Analysis
52
ICICI BANK_(Fin_Matter 1-64).ind52 52ICICI BANK_(Fin_Matter 1-64).ind52 52 6/20/08 5:03:12 PM6/20/08 5:03:12 PM