ICICI Bank 2008 Annual Report Download - page 175
Download and view the complete annual report
Please find page 175 of the 2008 ICICI Bank annual report below. You can navigate through the pages in the report by either clicking on the pages listed below, or by using the keyword search tool below to find specific information within the annual report.-
 1
1 -
2
-
3
-
4
-
5
-
6
-
7
-
8
-
9
-
10
-
11
-
12
-
13
-
14
-
15
-
16
-
17
-
18
-
19
-
20
-
21
-
22
-
23
-
24
-
25
-
26
-
27
-
28
-
29
-
30
-
31
-
32
-
33
-
34
-
35
-
36
-
37
-
38
-
39
-
40
-
41
-
42
-
43
-
44
-
45
-
46
-
47
-
48
-
49
-
50
-
51
-
52
-
53
-
54
-
55
-
56
-
57
-
58
-
59
-
60
-
61
-
62
-
63
-
64
-
65
-
66
-
67
-
68
-
69
-
70
-
71
-
72
-
73
-
74
-
75
-
76
-
77
-
78
-
79
-
80
-
81
-
82
-
83
-
84
-
85
-
86
-
87
-
88
-
89
-
90
-
91
-
92
-
93
-
94
-
95
-
96
-
97
-
98
-
99
-
100
-
101
-
102
-
103
-
104
-
105
-
106
-
107
-
108
-
109
-
110
-
111
-
112
-
113
-
114
-
115
-
116
-
117
-
118
-
119
-
120
-
121
-
122
-
123
-
124
-
125
-
126
-
127
-
128
-
129
-
130
-
131
-
132
-
133
-
134
-
135
-
136
-
137
-
138
-
139
-
140
-
141
-
142
-
143
-
144
-
145
-
146
-
147
-
148
-
149
-
150
-
151
-
152
-
153
-
154
-
155
-
156
-
157
-
158
-
159
-
160
-
161
-
162
-
163
-
164
-
 165
165 -
 166
166 -
 167
167 -
 168
168 -
 169
169 -
 170
170 -
 171
171 -
 172
172 -
 173
173 -
 174
174 -
 175
175 -
 176
176 -
 177
177 -
 178
178 -
 179
179 -
 180
180 -
 181
181 -
 182
182 -
 183
183 -
 184
184 -
 185
185 -
186
-
187
-
188
 |
 |

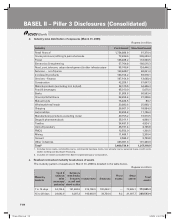
F101
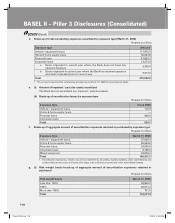
Maturity
buckets
Cash &
balance
with
monetary
authority
Balances
with banks
& money
at call and
short notice
Investments Advances
Fixed
assets
Other
assets Total
assets
29 days to
3 months 29,591.9 21,843.0 163,771.4 164,332.5 280.0 9,028.1 388,846.9
3 to 6 months 27,901.8 8,053.2 107,078.6 167,188.1 427.3 4,451.6 315,100.6
6 months to
1 year 47,935.1 8,299.5 178,467.8 277,411.7 1,180.7 4,517.4 517,812.2
1 to 3 years 48,622.1 2,235.0 220,117.6 875,614.7 5,202.2 13,813.2 1,165,604.7
3 to 5 years 6,750.0 2.5 66,341.7 379,748.9 494.1 2,778.6 456,115.8
Above 5 years 9,870.9 407.8 234,190.1 527,423.8 34,454.2 86,376.3 892,722.9
Total1295,088.2 182,071.1 1,389,169.8 2,525,918.2 42,046.6 225,397.9 4,659,691.8
1. Consolidated figures for ICICI Bank Limited, ICICI Bank UK PLC, ICICI Bank Canada, ICICI Bank Eurasia LLC, ICICI Home
Finance Company and ICICI Securities and its subsidiaries.
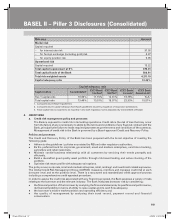
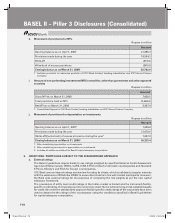
f. Amount of non-performing loans (NPL) (March 31, 2008)
Rupees in million
NPL Classification Gross NPLs1Net NPLs2
Sub-standard 48,847.3 31,569.9
Doubtful 22,300.3 3,628.0
– Doubtful 1316,450.1 2,256.4
– Doubtful 234,546.4 1,371.6
– Doubtful 331,303.8 —
Loss 5,269.6 —
Total476,417.2 35,197.9
NPL Ratio 2.99% 1.40%
1. Gross NPL ratio is computed as a ratio of Gross NPLs to Gross Advances.
2. Net NPL ratio is computed as a ratio of Net NPLs to Net Advances.
3. NPL outstanding for 456-820 days are classified as Doubtful 1, 820-1550 days as Doubtful 2 and above 1550 days as
Doubtful 3.
4. Includes advances portfolio of ICICI Bank Limited, banking subsidiaries and ICICI Home Finance Company.
g. Movement of NPL
Rupees in million
Gross Net
Opening Balance as on April 1, 2007 41,628.7 20,039.2
Additions during the year1,2 37,153.6 17,789.9
Reductions during the year (2,365.1) (2,631.2)
Closing balance as on March 31, 2008376,417.2 35,197.9
1. Excludes cases added to and deleted from NPLs in the same year.
2. The difference between the opening and closing balance of NPLs in retail loans is included in additions during
the year.
3. Includes advances portfolio of ICICI Bank Limited, banking subsidiaries and ICICI Home Finance Company.
BASEL II – Pillar 3 Disclosures (Consolidated)
1P-less_(Pillar).indd 1011P-less_(Pillar).indd 101 6/20/08 4:52:50 PM6/20/08 4:52:50 PM