ICICI Bank 2008 Annual Report Download - page 104
Download and view the complete annual report
Please find page 104 of the 2008 ICICI Bank annual report below. You can navigate through the pages in the report by either clicking on the pages listed below, or by using the keyword search tool below to find specific information within the annual report.-
 1
1 -
2
-
3
-
4
-
5
-
6
-
7
-
8
-
9
-
10
-
11
-
12
-
13
-
14
-
15
-
16
-
17
-
18
-
19
-
20
-
21
-
22
-
23
-
24
-
25
-
26
-
27
-
28
-
29
-
30
-
31
-
32
-
33
-
34
-
35
-
36
-
37
-
38
-
39
-
40
-
41
-
42
-
43
-
44
-
45
-
46
-
47
-
48
-
49
-
50
-
51
-
52
-
53
-
54
-
55
-
56
-
57
-
58
-
59
-
60
-
61
-
62
-
63
-
64
-
65
-
66
-
67
-
68
-
69
-
70
-
71
-
72
-
73
-
74
-
75
-
76
-
77
-
78
-
79
-
80
-
81
-
82
-
83
-
84
-
85
-
86
-
87
-
88
-
89
-
90
-
91
-
92
-
93
-
 94
94 -
 95
95 -
 96
96 -
 97
97 -
 98
98 -
 99
99 -
 100
100 -
 101
101 -
 102
102 -
 103
103 -
 104
104 -
 105
105 -
 106
106 -
 107
107 -
 108
108 -
 109
109 -
 110
110 -
 111
111 -
 112
112 -
 113
113 -
 114
114 -
115
-
116
-
117
-
118
-
119
-
120
-
121
-
122
-
123
-
124
-
125
-
126
-
127
-
128
-
129
-
130
-
131
-
132
-
133
-
134
-
135
-
136
-
137
-
138
-
139
-
140
-
141
-
142
-
143
-
144
-
145
-
146
-
147
-
148
-
149
-
150
-
151
-
152
-
153
-
154
-
155
-
156
-
157
-
158
-
159
-
160
-
161
-
162
-
163
-
164
-
165
-
166
-
167
-
168
-
169
-
170
-
171
-
172
-
173
-
174
-
175
-
176
-
177
-
178
-
179
-
180
-
181
-
182
-
183
-
184
-
185
-
186
-
187
-
188
 |
 |

F30
schedules
forming part of the Accounts (Contd.)
Black-Scholes model, compensation cost for the year ended March 31, 2008 would have been higher by Rs. 1,259.9 million
and proforma profit after tax would have been Rs. 40,317.4 million. On a proforma basis, ICICI Bank’s basic and diluted
earnings per share would have been Rs. 38.19 and Rs. 37.96 respectively. The key assumptions used to estimate the fair
value of options granted during the year ended March 31, 2008 are given below:
Risk-free interest rate .......................................................................................... 7.12% to 8.11%
Expected life ....................................................................................................... 2-6 years
Expected volatility ............................................................................................... 36.26% to 38.01%
Expected dividend yield ...................................................................................... 1.07%
The weighted average fair value of options granted during the year ended March 31, 2008 is Rs. 376.39.
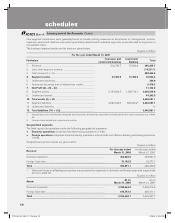
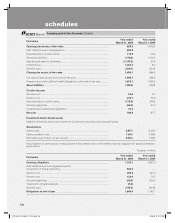
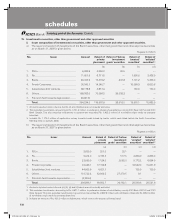
A summary of the status of the Bank’s stock option plan is given below:
Rupees, except number of options
Particulars
Stock options outstanding
Year ended March 31, 2008 Year ended March 31, 2007
Number of
options
Weighted
Average
Exercise Price
Number of
options
Weighted
Average
Exercise Price
Outstanding at the beginning of the year ................... 13,187,783 442.50 17,362,584 262.60
Add: Granted during the year ..................................... 4,956,300 938.41 6,439,900 582.26
Less: Lapsed during the year ..................................... 1,037,218 582.51 1,127,650 422.81
Less: Exercised during the year1 ................................ 1,468,713 379.34 9,487,051 210.47
Outstanding at the end of the year ............................. 15,638,152 596.32 13,187,783 442.50
Options exercisable .................................................... 3,272,292 411.89 326,259 225.80
1. Excludes options exercised but not allotted.
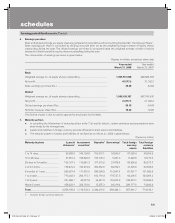
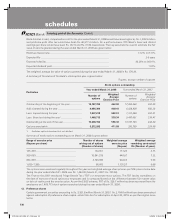
Summary of stock options outstanding as on March 31, 2008 is given below:
Range of exercise price
(Rupees per share)
Number of shares
arising out of options
(Number of shares)
Weighted average
exercise price
(Rupees)
Weighted average
remaining contractual
life (Number of years)
105–299 ............................................................. 164,951 151.20 3.75
300–599 ............................................................. 10,641,216 448.87 7.32
600–999 ............................................................. 4,745,985 932.63 9.08
1,000–1,399 ....................................................... 86,000 1,135.27 9.68
The options were exercised regularly throughout the year and weighted average share price as per NSE price volume data
during the year ended March 31, 2008 was Rs. 1,044.02 (March 31, 2007: Rs. 750.58).
The Finance Act 2007 introduced Fringe Benefit Tax (“FBT”) on employee stock options. The FBT liability crystallises on
the date of exercise of stock options by employees and is computed based on the difference between fair market value
on date of vesting and the exercise price. As per the ESOS scheme, FBT of Rs. 226.7 million has been recovered from the
employees on 1,468,713 stock options exercised during the year ended March 31, 2008.
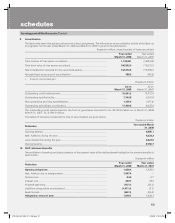
12. Preference shares
Certain government securities amounting to Rs. 2,331.8 million (March 31, 2007: Rs. 2,104.8 million) have been earmarked
against redemption of preference share capital, which falls due for redemption on April 20, 2018, as per the original issue
terms.
ICICI_BK_AR_2008_(F1_F46).indd 30ICICI_BK_AR_2008_(F1_F46).indd 30 6/20/08 3:25:26 PM6/20/08 3:25:26 PM