ICICI Bank 2008 Annual Report Download - page 84
Download and view the complete annual report
Please find page 84 of the 2008 ICICI Bank annual report below. You can navigate through the pages in the report by either clicking on the pages listed below, or by using the keyword search tool below to find specific information within the annual report.-
 1
1 -
2
-
3
-
4
-
5
-
6
-
7
-
8
-
9
-
10
-
11
-
12
-
13
-
14
-
15
-
16
-
17
-
18
-
19
-
20
-
21
-
22
-
23
-
24
-
25
-
26
-
27
-
28
-
29
-
30
-
31
-
32
-
33
-
34
-
35
-
36
-
37
-
38
-
39
-
40
-
41
-
42
-
43
-
44
-
45
-
46
-
47
-
48
-
49
-
50
-
51
-
52
-
53
-
54
-
55
-
56
-
57
-
58
-
59
-
60
-
61
-
62
-
63
-
64
-
65
-
66
-
67
-
68
-
69
-
70
-
71
-
72
-
73
-
 74
74 -
 75
75 -
 76
76 -
 77
77 -
 78
78 -
 79
79 -
 80
80 -
 81
81 -
 82
82 -
 83
83 -
 84
84 -
 85
85 -
 86
86 -
 87
87 -
 88
88 -
 89
89 -
 90
90 -
 91
91 -
 92
92 -
 93
93 -
 94
94 -
95
-
96
-
97
-
98
-
99
-
100
-
101
-
102
-
103
-
104
-
105
-
106
-
107
-
108
-
109
-
110
-
111
-
112
-
113
-
114
-
115
-
116
-
117
-
118
-
119
-
120
-
121
-
122
-
123
-
124
-
125
-
126
-
127
-
128
-
129
-
130
-
131
-
132
-
133
-
134
-
135
-
136
-
137
-
138
-
139
-
140
-
141
-
142
-
143
-
144
-
145
-
146
-
147
-
148
-
149
-
150
-
151
-
152
-
153
-
154
-
155
-
156
-
157
-
158
-
159
-
160
-
161
-
162
-
163
-
164
-
165
-
166
-
167
-
168
-
169
-
170
-
171
-
172
-
173
-
174
-
175
-
176
-
177
-
178
-
179
-
180
-
181
-
182
-
183
-
184
-
185
-
186
-
187
-
188
 |
 |

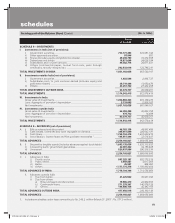
F10
SCHEDULE 10 – FIXED ASSETS
I. Premises
At cost as on March 31 of preceding year ................................................. 20,496,202 20,199,439
Additions during the year ........................................................................... 2,719,704 1,186,105
Deductions during the year ......................................................................... (272,987) (889,342)
Depreciation to date ................................................................................... (3,326,017) (2,608,478)
Net block ..................................................................................................... 19,616,902 17,887,724
II. Other fixed assets (including furniture and fixtures)
At cost as on March 31 of preceding year ................................................. 24,352,894 20,531,892
Additions during the year ............................................................................ 5,588,730 4,469,584
Deductions during the year ......................................................................... (603,577) (648,582)
Depreciation to date ................................................................................... (15,836,691) (13,038,759)
Net block ..................................................................................................... 13,501,356 11,314,135
III. Assets given on lease
At cost as on March 31 of preceding year ................................................. 18,136,532 18,954,323
Additions during the year ............................................................................ — —
Deductions during the year ......................................................................... (57,460) (817,791)
Depreciation to date, accumulated lease adjustment and provisions ...... (10,108,355) (8,104,159)
Net block ..................................................................................................... 7,970,717 10,032,373
TOTAL FIXED ASSETS ...................................................................................... 41,088,975 39,234,232
SCHEDULE 11 – OTHER ASSETS
I. Inter-office adjustments (net) ...................................................................... — 3,762,923
II. Interest accrued .......................................................................................... 34,867,173 29,417,095
III. Tax paid in advance / tax deducted at source (net) .................................... 40,660,994 37,661,011
IV. Stationery and stamps ................................................................................ 574 1,552
V. Non-banking assets acquired in satisfaction of claims 1 ........................... 3,658,544 3,536,564
VI. Others
a) Advance for capital assets .................................................................. 6,404,148 1,896,627
b) Outstanding fees and other income ................................................... 5,772,850 4,204,860
c) Swap suspense .................................................................................. — 168,266
d) Deposits ............................................................................................. 27,606,644 31,538,890
e) Deferred tax asset (net) ....................................................................... 13,233,940 6,099,534
f) Early retirement option expenses not written off ............................... 117,979 501,979
g) Others .................................................................................................. 73,423,410 46,109,933
TOTAL OTHER ASSETS ..................................................................................... 205,746,256 164,899,234
1. Includes certain non-banking assets acquired in satisfaction of claims which are in the process of being transferred in the
Bank's name.
SCHEDULE 12 – CONTINGENT LIABILITIES
I. Claims against the Bank not acknowledged as debts ................................ 40,306,033 39,115,895
II. Liability for partly paid investments ............................................................ 128,126 168,472
III. Liability on account of outstanding forward exchange contracts .............. 3,071,712,304 1,331,560,415
IV. Guarantees given on behalf of constituents
a) In India ................................................................................................. 338,313,547 241,625,310
b) Outside India ....................................................................................... 74,501,645 50,493,774
V. Acceptances, endorsements and other obligations ................................... 250,992,610 186,706,710
VI. Currency swaps .......................................................................................... 477,039,283 325,260,384
VII. Interest rate swaps, currency options and interest rate futures 1 .............. 7,067,956,457 3,346,921,704
VIII. Other items for which the Bank is contingently liable ................................ 192,540,108 107,746,396
TOTAL CONTINGENT LIABILITIES ................................................................... 11,513,490,113 5,629,599,060
1. Excludes notional amount of options sold amounting to Rs. 597,333.2 million (March 31, 2007 : Rs. 444,221.2 million).
As on As on
31.03.2008 31.03.2007
schedules
forming part of the Balance Sheet (Contd.) (Rs. in ‘000s)
ICICI_BK_AR_2008_(F1_F46).indd 10ICICI_BK_AR_2008_(F1_F46).indd 10 6/20/08 3:24:23 PM6/20/08 3:24:23 PM