ICICI Bank 2008 Annual Report Download - page 131
Download and view the complete annual report
Please find page 131 of the 2008 ICICI Bank annual report below. You can navigate through the pages in the report by either clicking on the pages listed below, or by using the keyword search tool below to find specific information within the annual report.-
 1
1 -
2
-
3
-
4
-
5
-
6
-
7
-
8
-
9
-
10
-
11
-
12
-
13
-
14
-
15
-
16
-
17
-
18
-
19
-
20
-
21
-
22
-
23
-
24
-
25
-
26
-
27
-
28
-
29
-
30
-
31
-
32
-
33
-
34
-
35
-
36
-
37
-
38
-
39
-
40
-
41
-
42
-
43
-
44
-
45
-
46
-
47
-
48
-
49
-
50
-
51
-
52
-
53
-
54
-
55
-
56
-
57
-
58
-
59
-
60
-
61
-
62
-
63
-
64
-
65
-
66
-
67
-
68
-
69
-
70
-
71
-
72
-
73
-
74
-
75
-
76
-
77
-
78
-
79
-
80
-
81
-
82
-
83
-
84
-
85
-
86
-
87
-
88
-
89
-
90
-
91
-
92
-
93
-
94
-
95
-
96
-
97
-
98
-
99
-
100
-
101
-
102
-
103
-
104
-
105
-
106
-
107
-
108
-
109
-
110
-
111
-
112
-
113
-
114
-
115
-
116
-
117
-
118
-
119
-
120
-
 121
121 -
 122
122 -
 123
123 -
 124
124 -
 125
125 -
 126
126 -
 127
127 -
 128
128 -
 129
129 -
 130
130 -
 131
131 -
 132
132 -
 133
133 -
 134
134 -
 135
135 -
 136
136 -
 137
137 -
 138
138 -
 139
139 -
 140
140 -
 141
141 -
142
-
143
-
144
-
145
-
146
-
147
-
148
-
149
-
150
-
151
-
152
-
153
-
154
-
155
-
156
-
157
-
158
-
159
-
160
-
161
-
162
-
163
-
164
-
165
-
166
-
167
-
168
-
169
-
170
-
171
-
172
-
173
-
174
-
175
-
176
-
177
-
178
-
179
-
180
-
181
-
182
-
183
-
184
-
185
-
186
-
187
-
188
 |
 |

F57
schedules
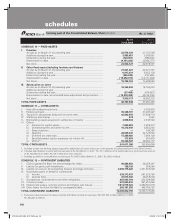
SCHEDULE 8 — INVESTMENTS
I. Investments in India (net of provisions)
i) Government securities ........................................................................ 786,560,746 696,367,000
ii) Other approved securities................................................................... 97,946 601
iii) Shares (includes equity and preference shares)1 ............................... 47,118,726 40,895,698
iv) Debentures and bonds ....................................................................... 49,447,032 45,829,459
v) Assets held to cover linked liabilities of life insurance business ...... 248,450,720 128,906,303
vi) Others (commercial paper, mutual fund units, pass through
certificates, security receipts etc.) ...................................................... 210,887,719 114,689,000
TOTAL INVESTMENTS IN INDIA ............................................................. 1,342,562,889 1,026,688,061
II. Investments outside India (net of provisions)
i) Government securities ........................................................................ 40,889,298 20,748,958
ii) Others .................................................................................................. 217,005,392 158,729,879
TOTAL INVESTMENTS OUTSIDE INDIA ................................................. 257,904,690 179,478,837
TOTAL INVESTMENTS ..................................................................................... 1,600,467,579 1,206,166,898
III. Investments in India
Gross value of investments2 ...................................................................... 1,340,676,954 1,026,171,288
Less: Aggregate of provision/depreciation/(appreciation) ........................ (1,885,935) (516,773)
Net investments ......................................................................................... 1,342,562,889 1,026,688,061
IV. Investments outside India
Gross value of investments ....................................................................... 267,772,200 179,552,465
Less: Aggregate of provision/depreciation/(appreciation) ........................ 9,867,510 73,628
Net investments ......................................................................................... 257,904,690 179,478,837
TOTAL INVESTMENTS ..................................................................................... 1,600,467,579 1,206,166,898
1. Includes investment in associate of Rs. 95.4 million (March 31, 2007 : Rs. Nil).
2, Net of appreciation of Rs. 19,534.4 million (March 31, 2007 : Rs. 13,258.4 million) on investment held to cover linked liabilities of life
insurance business.
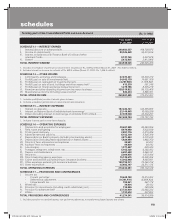
SCHEDULE 9 — ADVANCES (net of provisions)
A. i) Bills purchased and discounted .......................................................... 47,896,278 47,473,577
ii) Cash credits, overdrafts and loans repayable on demand ................. 351,458,670 334,781,882
iii) Term loans........................................................................................... 2,009,110,336 1,659,223,017
iv) Securitisation, finance lease and hire purchase receivables1 ............. 105,551,409 72,515,937
TOTAL ADVANCES ................................................................................... 2,514,016,693 213,994,413
B. i) Secured by tangible assets [includes advances against book debts] 1,928,756,159 1,602,564,461
ii) Covered by bank/government guarantees .......................................... 42,087,202 87,960,211
iii) Unsecured ........................................................................................... 543,173,332 423,469,741
TOTAL ADVANCES ................................................................................... 2,514,016,693 2,113,994,413
C. I. Advances in India
i) Priority sector .............................................................................. 606,025,758 555,491,571
ii) Public sector ................................................................................ 3,559,887 4,017,005
iii) Banks ........................................................................................... 45,947 906,063
iv) Others .......................................................................................... 1,229,874,572 1,194,443,625
TOTAL ADVANCES IN INDIA ................................................................... 1,839,506,164 1,754,858,264
II. Advances outside India
i) Due from banks ........................................................................... 53,593,670 50,979,277
ii) Due from others
a) Bills purchased and discounted .......................................... 21,006,755 24,521,767
b) Commercial loans................................................................ 324,669,709 178,608,073
c) Others .................................................................................. 275,240,395 105,027,032
TOTAL ADVANCES OUTSIDE INDIA ....................................................... 674,510,529 359,136,149
TOTAL ADVANCES ........................................................................................... 2,514,016,693 2,113,994,413
1. Includes receivables under lease amounting to Rs. 349.2 million (March 31, 2007 : Rs. 577.9 million).
(Rs. in ‘000s)
forming part of the Consolidated Balance Sheet (Contd.)
As on As on
31.03.2008 31.03.2007
ICICI_BK_AR_2008_(F47_F92).indd 57ICICI_BK_AR_2008_(F47_F92).indd 57 6/20/08 3:31:47 PM6/20/08 3:31:47 PM