ICICI Bank 2008 Annual Report Download - page 53
Download and view the complete annual report
Please find page 53 of the 2008 ICICI Bank annual report below. You can navigate through the pages in the report by either clicking on the pages listed below, or by using the keyword search tool below to find specific information within the annual report.-
 1
1 -
2
-
3
-
4
-
5
-
6
-
7
-
8
-
9
-
10
-
11
-
12
-
13
-
14
-
15
-
16
-
17
-
18
-
19
-
20
-
21
-
22
-
23
-
24
-
25
-
26
-
27
-
28
-
29
-
30
-
31
-
32
-
33
-
34
-
35
-
36
-
37
-
38
-
39
-
40
-
41
-
42
-
 43
43 -
 44
44 -
 45
45 -
 46
46 -
 47
47 -
 48
48 -
 49
49 -
 50
50 -
 51
51 -
 52
52 -
 53
53 -
 54
54 -
 55
55 -
 56
56 -
 57
57 -
 58
58 -
 59
59 -
 60
60 -
 61
61 -
 62
62 -
 63
63 -
64
-
65
-
66
-
67
-
68
-
69
-
70
-
71
-
72
-
73
-
74
-
75
-
76
-
77
-
78
-
79
-
80
-
81
-
82
-
83
-
84
-
85
-
86
-
87
-
88
-
89
-
90
-
91
-
92
-
93
-
94
-
95
-
96
-
97
-
98
-
99
-
100
-
101
-
102
-
103
-
104
-
105
-
106
-
107
-
108
-
109
-
110
-
111
-
112
-
113
-
114
-
115
-
116
-
117
-
118
-
119
-
120
-
121
-
122
-
123
-
124
-
125
-
126
-
127
-
128
-
129
-
130
-
131
-
132
-
133
-
134
-
135
-
136
-
137
-
138
-
139
-
140
-
141
-
142
-
143
-
144
-
145
-
146
-
147
-
148
-
149
-
150
-
151
-
152
-
153
-
154
-
155
-
156
-
157
-
158
-
159
-
160
-
161
-
162
-
163
-
164
-
165
-
166
-
167
-
168
-
169
-
170
-
171
-
172
-
173
-
174
-
175
-
176
-
177
-
178
-
179
-
180
-
181
-
182
-
183
-
184
-
185
-
186
-
187
-
188
 |
 |

Towards a better life
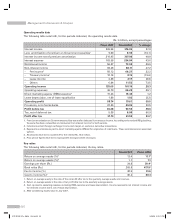
Net interest income and spread analysis
The following table sets forth, for the periods indicated, the net interest income and spread analysis.
Rs. in billion, except percentages
Fiscal 2007 Fiscal 2008 % change
Average interest-earning assets 2,577.27 3,288.34 27.6
Average interest-bearing liabilities 2,484.99 3,119.28 25.5
Net interest margin 2.2% 2.2% —
Average yield 8.5% 9.4% —
Average cost of funds 6.6% 7.5% —
Interest spread 1.9% 1.8% —
1. All amounts have been rounded off to the nearest Rs. 10.0 million.
Net interest income
Net interest income increased by 29.6% to Rs. 73.04 billion in fiscal 2008 from Rs. 56.37 billion in fiscal 2007,
reflecting mainly the following:
l an increase of Rs. 711.07 billion or 27.6% in the average volume of interest-earning assets; and
l an increase in net interest margin to 2.22% in fiscal 2008 compared to 2.19% in fiscal 2007.
Total interest income increased by 37.8% to Rs. 316.86 billion in fiscal 2008 from Rs. 229.94 billion in fiscal 2007
and interest income, net of amortisation on Government securities, increased by 40.0% to Rs. 307.88 billion in
fiscal 2008 from Rs. 219.95 billion in fiscal 2007 primarily due to an increase of 27.6% in the average interest-
earning assets and an increase of 83 basis points in yield on average interest-earning assets.
The average volume of interest-earning assets increased by Rs. 711.07 billion in fiscal 2008 as compared to fiscal
2007 primarily due to the increase in average advances by Rs. 417.05 billion and increase in average investments
by Rs. 242.63 billion. The increase in average advances was primarily due to increase in advances of overseas
branches and the increase in average investments was primarily due to increased investment in Government
securities. Net advances of overseas branches increased by 95.6% to Rs. 477.46 billion at year-end fiscal 2008
from Rs. 244.10 billion at year-end fiscal 2007.
Yield on average interest-earning assets increased to 9.4% in fiscal 2008 compared to 8.5% in fiscal 2007 primarily
due to the increase in the yield on advances by 116 basis points to 11.1% in fiscal 2008 from 9.9% in fiscal 2007.
The yield on advances has increased due to an increase in lending rates in line with the general increase in interest
rates and increase in the volumes of certain high yielding loans. This was partly offset by increase in the cash
reserve ratio (CRR) by RBI by 150 basis points during the year resulting in an adverse impact on yields. The yield
on average interest-earning investments also increased to 7.7% in fiscal 2008 from 6.8% in fiscal 2007.
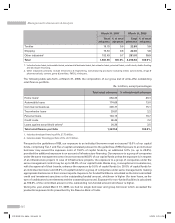
Interest expense increased by 43.6% to Rs. 234.84 billion in fiscal 2008 from Rs. 163.58 billion in fiscal 2007
primarily due to an increase of 25.5% in the volume of average interest-bearing liabilities to Rs. 3,119.28 billion
in fiscal 2008 from Rs. 2,484.99 billion in fiscal 2007 and increase in the cost of funds by 95 basis points to 7.5%
in fiscal 2008 from 6.6% in fiscal 2007. Total deposits at year-end fiscal 2008 constituted 73.9% of our funding
(i.e. deposits, borrowings and subordinated debts) compared to 76.5% at year-end fiscal 2007. Total deposits
increased by 6.0% to Rs. 2,444.31 billion at year-end fiscal 2008 from Rs. 2,305.10 billion at year-end fiscal 2007.
The proportion of current and savings account deposits in total deposits increased to 26.1% at year-end fiscal 2008
from 21.8% at year-end fiscal 2007. This is commensurate with our focus on increasing funding through low-cost
deposits and retail deposits. The cost of deposits increased by 133 basis points to 7.5% in fiscal 2008 from 6.2%
in fiscal 2007 consequent to general increase in interest rates in the system, and in particular the tight systemic
liquidity scenario during the quarter ended March 31, 2007, the impact of which was fully reflected during fiscal
2008. The average cost of borrowings declined to 7.5% in fiscal 2008 from 7.7% in fiscal 2007 primarily due to
increase in the proportion of foreign currency borrowings of overseas branches in the total borrowings.
Annual Report 2007-2008 51
ICICI BANK_(Fin_Matter 1-64).ind51 51ICICI BANK_(Fin_Matter 1-64).ind51 51 6/20/08 5:03:12 PM6/20/08 5:03:12 PM