ICICI Bank 2008 Annual Report Download - page 174
Download and view the complete annual report
Please find page 174 of the 2008 ICICI Bank annual report below. You can navigate through the pages in the report by either clicking on the pages listed below, or by using the keyword search tool below to find specific information within the annual report.-
 1
1 -
2
-
3
-
4
-
5
-
6
-
7
-
8
-
9
-
10
-
11
-
12
-
13
-
14
-
15
-
16
-
17
-
18
-
19
-
20
-
21
-
22
-
23
-
24
-
25
-
26
-
27
-
28
-
29
-
30
-
31
-
32
-
33
-
34
-
35
-
36
-
37
-
38
-
39
-
40
-
41
-
42
-
43
-
44
-
45
-
46
-
47
-
48
-
49
-
50
-
51
-
52
-
53
-
54
-
55
-
56
-
57
-
58
-
59
-
60
-
61
-
62
-
63
-
64
-
65
-
66
-
67
-
68
-
69
-
70
-
71
-
72
-
73
-
74
-
75
-
76
-
77
-
78
-
79
-
80
-
81
-
82
-
83
-
84
-
85
-
86
-
87
-
88
-
89
-
90
-
91
-
92
-
93
-
94
-
95
-
96
-
97
-
98
-
99
-
100
-
101
-
102
-
103
-
104
-
105
-
106
-
107
-
108
-
109
-
110
-
111
-
112
-
113
-
114
-
115
-
116
-
117
-
118
-
119
-
120
-
121
-
122
-
123
-
124
-
125
-
126
-
127
-
128
-
129
-
130
-
131
-
132
-
133
-
134
-
135
-
136
-
137
-
138
-
139
-
140
-
141
-
142
-
143
-
144
-
145
-
146
-
147
-
148
-
149
-
150
-
151
-
152
-
153
-
154
-
155
-
156
-
157
-
158
-
159
-
160
-
161
-
162
-
163
-
 164
164 -
 165
165 -
 166
166 -
 167
167 -
 168
168 -
 169
169 -
 170
170 -
 171
171 -
 172
172 -
 173
173 -
 174
174 -
 175
175 -
 176
176 -
 177
177 -
 178
178 -
 179
179 -
 180
180 -
 181
181 -
 182
182 -
 183
183 -
 184
184 -
185
-
186
-
187
-
188
 |
 |

F100
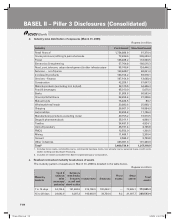
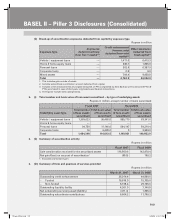
d. Industry-wise distribution of exposures (March 31, 2008)
Rupees in million
Industry Fund-based Non-fund based
Retail finance11,724,896.8 61,379.4
Crude petroleum/refining & petrochemicals 72,828.6 206,620.4
Power 138,408.2 118,900.5
Electronics & engineering 57,704.8 180,515.3
Road, port, telecom, urban development & other infrastructure 95,748.4 124,446.2
Services – non-finance 163,848.7 40,961.4
Iron/steel & products 103,154.2 59,918.1
Services – finance 107,164.8 13,698.4
Construction 42,255.1 67,647.3
Metal & products (excluding iron & steel) 38,105.5 64,446.3
Food & beverages 95,919.0 5,675.6
Banks 31,809.6 56,563.4
Chemical & fertilisers 58,454.4 27,208.6
Mutual funds 76,426.5 89.7
Wholesale/retail trade 29,892.6 25,868.1
Shipping 26,607.9 18,984.9
Automobiles 33,459.8 11,746.4
Manufacturing products excluding metal 29,755.2 10,970.5
Drugs & pharmaceuticals 35,011.1 4,980.1
Textiles 34,497.5 4,924.1
Gems & jewellery 28,157.4 4,196.8
FMCG 12,553.0 1,326.5
Mining 11,480.1 2,200.4
Cement 9,588.2 2,709.8
Other industries 423,007.3 101,340.0
Total23,480,734.9 1,217,318.0
1. Includes home loans, automobile loans, commercial business loans, two wheeler loans, personal loans, credit cards,
dealer funding and developer financing.
2. Includes all entities considered for Basel II capital adequacy computation.
e. Residual contractual maturity break-down of assets
The maturity pattern of assets as on March 31, 2008 is detailed in the table below.
Rupees in million
Maturity
buckets
Cash &
balance
with
monetary
authority
Balances
with banks
& money
at call and
short notice
Investments Advances
Fixed
assets
Other
assets Total
assets
1 to 14 days 94,724.5 131,842.8 314,108.9 100,444.1 — 72,825.1 713,945.3
15 to 28 days 29,692.0 9,387.3 105,093.8 33,754.4 8.2 31,607.7 209,543.4
BASEL II – Pillar 3 Disclosures (Consolidated)
1P-less_(Pillar).indd 1001P-less_(Pillar).indd 100 6/20/08 4:52:47 PM6/20/08 4:52:47 PM