ICICI Bank 2008 Annual Report Download - page 111
Download and view the complete annual report
Please find page 111 of the 2008 ICICI Bank annual report below. You can navigate through the pages in the report by either clicking on the pages listed below, or by using the keyword search tool below to find specific information within the annual report.-
 1
1 -
2
-
3
-
4
-
5
-
6
-
7
-
8
-
9
-
10
-
11
-
12
-
13
-
14
-
15
-
16
-
17
-
18
-
19
-
20
-
21
-
22
-
23
-
24
-
25
-
26
-
27
-
28
-
29
-
30
-
31
-
32
-
33
-
34
-
35
-
36
-
37
-
38
-
39
-
40
-
41
-
42
-
43
-
44
-
45
-
46
-
47
-
48
-
49
-
50
-
51
-
52
-
53
-
54
-
55
-
56
-
57
-
58
-
59
-
60
-
61
-
62
-
63
-
64
-
65
-
66
-
67
-
68
-
69
-
70
-
71
-
72
-
73
-
74
-
75
-
76
-
77
-
78
-
79
-
80
-
81
-
82
-
83
-
84
-
85
-
86
-
87
-
88
-
89
-
90
-
91
-
92
-
93
-
94
-
95
-
96
-
97
-
98
-
99
-
100
-
 101
101 -
 102
102 -
 103
103 -
 104
104 -
 105
105 -
 106
106 -
 107
107 -
 108
108 -
 109
109 -
 110
110 -
 111
111 -
 112
112 -
 113
113 -
 114
114 -
 115
115 -
 116
116 -
 117
117 -
 118
118 -
 119
119 -
 120
120 -
 121
121 -
122
-
123
-
124
-
125
-
126
-
127
-
128
-
129
-
130
-
131
-
132
-
133
-
134
-
135
-
136
-
137
-
138
-
139
-
140
-
141
-
142
-
143
-
144
-
145
-
146
-
147
-
148
-
149
-
150
-
151
-
152
-
153
-
154
-
155
-
156
-
157
-
158
-
159
-
160
-
161
-
162
-
163
-
164
-
165
-
166
-
167
-
168
-
169
-
170
-
171
-
172
-
173
-
174
-
175
-
176
-
177
-
178
-
179
-
180
-
181
-
182
-
183
-
184
-
185
-
186
-
187
-
188
 |
 |

F37
schedules
forming part of the Accounts (Contd.)
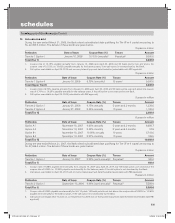
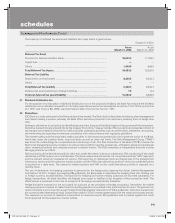
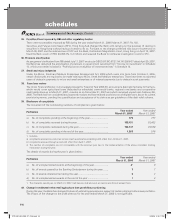
18. Details of Single Borrower Limit (“SBL”), Group Borrower Limit (“GBL”) exceeded by the Bank
During the year ended March 31, 2008, the Bank had no single borrower and group borrower, which exceeded the prudential
exposure limits prescribed by RBI.
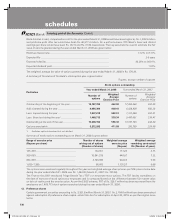
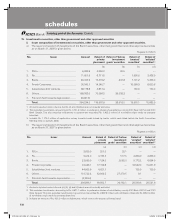
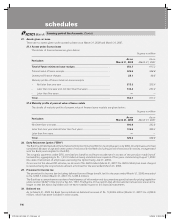
19. Risk category-wise country-wise exposure
As per the extant RBI guidelines, the country exposure of the Bank is categorised into various risk categories listed in
the following table. The funded country exposure (net) of the Bank in respect of United Kingdom is 1.81% and United
States of America is 1.57% of the total funded assets as on March 31, 2008 (as on March 31, 2007: United Kingdom was
0.98% and United States of America was 0.68%). As the net funded exposure to United Kingdom and United States of
America exceeds 1% of total funded assets, the Bank has made a provision of Rs. 245.0 million on country exposure as on
March 31, 2008 (Provision as on March 31, 2007: Nil). Rupees in million
Risk category Exposure (net)
as on
March 31, 2008
Provision held
as at
March 31, 2008
Exposure (net)
as on
March 31, 2007
Provision held
as at
March 31, 2007
Insignificant ........................................................ 435,312.7 245.0 277,784.2 —
Low ..................................................................... 167,234.5 — 126,883.7 —
Moderate ............................................................ 36,697.3 — 20,616.3 —
High .................................................................... 4,730.7 — 1,565.1 —
Very High ............................................................ 22.1 — 404.3 —
Restricted ........................................................... ————
Off-Credit ............................................................ ————
Total ................................................................... 643,997.3 245.0 427,253.6 —
- of which funded ............................................... 403,791.3 — 308,348.8 —
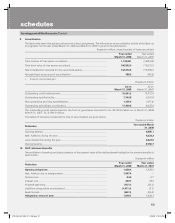
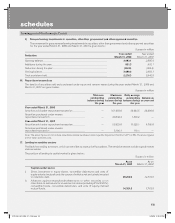
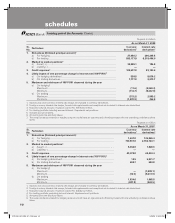
20. Advances
The details of movement of gross NPAs, net NPAs and provisions during year ended March 31, 2008 and March 31, 2007
are given in the table below: Rupees in million
Particulars Year ended
March 31, 20083
Year ended
March 31, 2007
i) Net NPAs (funded) to Net Advances (%) ................................................... 1.55% 1.02%
ii) Movement of NPAs (Gross)
a) Opening Balance ................................................................................... 41,260.6 22,225.9
b) Additions during the year1, 2 .................................................................. 36,896.6 21,610.0
c) Reductions during the year1 ................................................................. (2,361.8) (2,575.3)
d) Closing balance4 .................................................................................... 75,795.4 41,260.6
iii) Movement of Net NPAs
a) Opening Balance ................................................................................... 19,920.4 10,526.8
b) Additions during the year1, 2 .................................................................. 17,616.3 11,835.8
c) Reductions during the year1 .................................................................. (2,631.2) (2,442.2)
d) Closing balance .................................................................................... 34,905.5 19,920.4
iv) Movement of provisions for NPAs
(excluding provisions on standard assets)
a) Opening Balance5 .................................................................................. 20,835.9 11,427.5
b) Provisions made during the year6 ......................................................... 19,510.7 11,179.5
c) Write-off/write-back of excess provisions ............................................ (913.9) (1,771.1)
d) Closing balance5 .................................................................................... 39,432.7 20,835.9
1. Excludes cases added to and deleted from NPAs in the same year with such gross loans amounting to Rs. 2,203.2 million
(March 31, 2007: Rs. 7,841.8 million) and such net loans amounting to Rs. 1,968.6 million (March 31, 2007: Rs. 6,770.8 million).
2. The difference between the opening and closing balances of NPAs in retail loans is included in additions during the year.
3. Includes non-performing loans acquired on merger of Sangli Bank.
4. Includes suspended interest and claims received from ECGC/DICGC of Rs. 1,457.2 million (March 31, 2007: Rs. 504.3 million) on working
capital loan.
5. Excludes technical write-off amounting to Rs. 6,076.1 million (March 31, 2007: Rs. 6,230.5 million) and suspended interest and claims
received from ECGC/DICGC of Rs. 1,457.2 million (March 31, 2007: Rs. 504.3 million).
6. Net of reduction in provisions due to sale of retail non-performing assets.
There was no change in the floating provision of Rs. 2,841.7 million, which is included in the total NPA provision.
ICICI_BK_AR_2008_(F1_F46).indd 37ICICI_BK_AR_2008_(F1_F46).indd 37 6/20/08 3:25:50 PM6/20/08 3:25:50 PM