ICICI Bank 2008 Annual Report Download - page 59
Download and view the complete annual report
Please find page 59 of the 2008 ICICI Bank annual report below. You can navigate through the pages in the report by either clicking on the pages listed below, or by using the keyword search tool below to find specific information within the annual report.-
 1
1 -
2
-
3
-
4
-
5
-
6
-
7
-
8
-
9
-
10
-
11
-
12
-
13
-
14
-
15
-
16
-
17
-
18
-
19
-
20
-
21
-
22
-
23
-
24
-
25
-
26
-
27
-
28
-
29
-
30
-
31
-
32
-
33
-
34
-
35
-
36
-
37
-
38
-
39
-
40
-
41
-
42
-
43
-
44
-
45
-
46
-
47
-
48
-
 49
49 -
 50
50 -
 51
51 -
 52
52 -
 53
53 -
 54
54 -
 55
55 -
 56
56 -
 57
57 -
 58
58 -
 59
59 -
 60
60 -
 61
61 -
 62
62 -
 63
63 -
 64
64 -
 65
65 -
 66
66 -
 67
67 -
 68
68 -
 69
69 -
70
-
71
-
72
-
73
-
74
-
75
-
76
-
77
-
78
-
79
-
80
-
81
-
82
-
83
-
84
-
85
-
86
-
87
-
88
-
89
-
90
-
91
-
92
-
93
-
94
-
95
-
96
-
97
-
98
-
99
-
100
-
101
-
102
-
103
-
104
-
105
-
106
-
107
-
108
-
109
-
110
-
111
-
112
-
113
-
114
-
115
-
116
-
117
-
118
-
119
-
120
-
121
-
122
-
123
-
124
-
125
-
126
-
127
-
128
-
129
-
130
-
131
-
132
-
133
-
134
-
135
-
136
-
137
-
138
-
139
-
140
-
141
-
142
-
143
-
144
-
145
-
146
-
147
-
148
-
149
-
150
-
151
-
152
-
153
-
154
-
155
-
156
-
157
-
158
-
159
-
160
-
161
-
162
-
163
-
164
-
165
-
166
-
167
-
168
-
169
-
170
-
171
-
172
-
173
-
174
-
175
-
176
-
177
-
178
-
179
-
180
-
181
-
182
-
183
-
184
-
185
-
186
-
187
-
188
 |
 |

Towards a better life
Consumer credit and capital market claims attract 125% risk weight and commercial real estate claims attract
150% risk weight under both Basel I and Basel II guidelines.
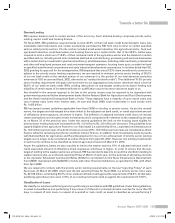
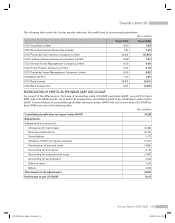
Our Tier-1 capital after deductions, under the new guidelines is higher compared to the Basel I guidelines, while
risk weighted assets under Basel II guidelines are higher than under Basel I guidelines. Our capital adequacy
calculated in accordance with the Basel I guidelines at year-end fiscal 2008 was 14.92%, including Tier-1 capital
adequacy ratio of 11.32% and Tier-2 capital adequacy ratio of 3.60%. The capital adequacy calculated in accordance
with the Basel II guidelines at year-end fiscal 2008 was 13.97%, including Tier-1 capital adequacy ratio of 11.76%
and Tier-2 capital adequacy ratio of 2.20%. For the current year, we are required to maintain capital at the level
required by Basel I or Basel II, whichever is higher. The minimum capital required to be maintained by us as per
Basel II guidelines is higher than that under Basel I guidelines.
ASSET QUALITY AND COMPOSITION
Loan Concentration
We follow a policy of portfolio diversification and evaluate our total financing in a particular sector in light of our
forecasts of growth and profitability for that sector. Between 2003 and 2006 the banking system as a whole saw
significant expansion of retail credit, with retail loans accounting for a major part of overall systemic credit growth.
Accordingly, during these years, we increased our financing to retail finance. Recently, due to the increase in
interest rates, retail credit growth in the banking system has moderated from its peak levels. At the same time,
there has been an increase in demand for credit from the corporate sector, especially for foreign currency financing.
Following this trend, our loans and advances to retail finance constituted 58.6% of our total loans and advances
at year-end fiscal 2008 compared to 65.2% at year-end fiscal 2007.
Our Global Credit Risk Management Group monitors all major sectors of the economy and specifically follows
sectors to which we have loans outstanding. We seek to respond to any economic weakness in an industrial
segment by restricting new exposures to that segment and any growth in an industrial segment by increasing
new exposures to that segment, resulting in active portfolio management.
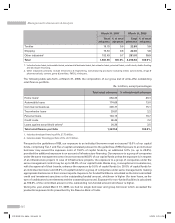
The following tables set forth, at the dates indicated, the composition of our gross advances (net of write-offs).
Rs. in billion, except percentages
March 31, 2007 March 31, 2008
Total
advances % of total
advances Total
advances % of total
advances
Retail finance1 1,292.81 65.2 1,347.54 58.6
Services - non-finance 56.25 2.8 145.57 6.3
Iron/steel & products 50.15 2.5 93.23 4.1
Services–finance 96.16 4.9 66.18 2.9
Food & beverages 44.17 2.2 63.32 2.8
Crude petroleum/Refining & petrochemicals 48.57 2.5 58.21 2.5
Power 41.28 2.1 58.08 2.5
Road, port, telecom, urban development & other infrastructure 29.87 1.5 51.45 2.2
Chemical & fertilizers 48.79 2.5 38.06 1.7
Construction 15.29 0.8 29.36 1.3
Metal & products (excluding iron & steel) 9.21 0.5 26.30 1.1
Wholesale/retail trade 24.63 1.2 25.26 1.1
Annual Report 2007-2008 57
ICICI BANK_(Fin_Matter 1-64).ind57 57ICICI BANK_(Fin_Matter 1-64).ind57 57 6/20/08 5:03:14 PM6/20/08 5:03:14 PM