ICICI Bank 2008 Annual Report Download - page 60
Download and view the complete annual report
Please find page 60 of the 2008 ICICI Bank annual report below. You can navigate through the pages in the report by either clicking on the pages listed below, or by using the keyword search tool below to find specific information within the annual report.-
 1
1 -
2
-
3
-
4
-
5
-
6
-
7
-
8
-
9
-
10
-
11
-
12
-
13
-
14
-
15
-
16
-
17
-
18
-
19
-
20
-
21
-
22
-
23
-
24
-
25
-
26
-
27
-
28
-
29
-
30
-
31
-
32
-
33
-
34
-
35
-
36
-
37
-
38
-
39
-
40
-
41
-
42
-
43
-
44
-
45
-
46
-
47
-
48
-
49
-
 50
50 -
 51
51 -
 52
52 -
 53
53 -
 54
54 -
 55
55 -
 56
56 -
 57
57 -
 58
58 -
 59
59 -
 60
60 -
 61
61 -
 62
62 -
 63
63 -
 64
64 -
 65
65 -
 66
66 -
 67
67 -
 68
68 -
 69
69 -
 70
70 -
71
-
72
-
73
-
74
-
75
-
76
-
77
-
78
-
79
-
80
-
81
-
82
-
83
-
84
-
85
-
86
-
87
-
88
-
89
-
90
-
91
-
92
-
93
-
94
-
95
-
96
-
97
-
98
-
99
-
100
-
101
-
102
-
103
-
104
-
105
-
106
-
107
-
108
-
109
-
110
-
111
-
112
-
113
-
114
-
115
-
116
-
117
-
118
-
119
-
120
-
121
-
122
-
123
-
124
-
125
-
126
-
127
-
128
-
129
-
130
-
131
-
132
-
133
-
134
-
135
-
136
-
137
-
138
-
139
-
140
-
141
-
142
-
143
-
144
-
145
-
146
-
147
-
148
-
149
-
150
-
151
-
152
-
153
-
154
-
155
-
156
-
157
-
158
-
159
-
160
-
161
-
162
-
163
-
164
-
165
-
166
-
167
-
168
-
169
-
170
-
171
-
172
-
173
-
174
-
175
-
176
-
177
-
178
-
179
-
180
-
181
-
182
-
183
-
184
-
185
-
186
-
187
-
188
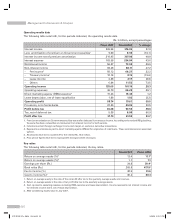
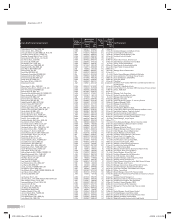
 |
 |

March 31, 2007 March 31, 2008
Total
advances % of total
advances Total
advances % of total
advances
Textiles 16.79 0.8 22.89 1.0
Shipping 15.53 0.8 22.46 1.0
Other industries2192.43 9.7 251.01 10.9
Total 1,981.93 100.0% 2,298.92 100.0%
1. Includes home loans, automobile loans, commercial business loans, two wheeler loans, personal loans, credit cards, dealer funding
and developer financing.
2. Other industries primarily include electronics & engineering, manufacturing products excluding metal, automobiles, drugs &
pharmaceuticals, cement, gems & jewellery, FMCG, mining etc.
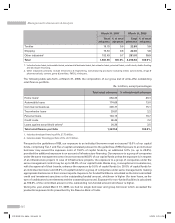
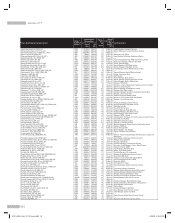
The following table sets forth, at March 31, 2008, the composition of our gross (net of write-offs) outstanding
retail finance portfolio.
Rs. in billion, except percentages
Total retail advances % of total retail advances
Home loans1664.39 49.3
Automobile loans 174.66 13.0
Commercial business 203.71 15.1
Two-wheeler loans 29.81 2.2
Personal loans 144.13 10.7
Credit cards 96.45 7.2
Loans against securities & others234.39 2.5
Total retail finance portfolio 1,347.54 100.0%
1. Includes developer financing of Rs. 27.79 billion.
2. Includes dealer financing portfolio of Rs. 24.10 billion.
Pursuant to the guidelines of RBI, our exposure to an individual borrower must not exceed 15.0% of our capital
funds, comprising Tier-1 and Tier-2 capital calculated pursuant to the guidelines of RBI. Exposure to an individual
borrower may exceed the exposure norm of 15.0% of capital funds by an additional 5.0% (i.e. up to 20.0%)
provided the additional exposure is on account of infrastructure financing. Our exposure to a group of companies
under the same management control must not exceed 40.0% of our capital funds unless the exposure is in respect
of an infrastructure project. In case of infrastructure projects, the exposure to a group of companies under the
same management control may be up to 50.0% of our capital funds. Banks may, in exceptional circumstances,
with the approval of their boards, enhance the exposure by 5.0% of capital funds (i.e. 20.0% of capital funds for
an individual borrower and 45.0% of capital funds for a group of companies under same management), making
appropriate disclosures in their annual reports. Exposure for funded facilities is calculated as the total committed
credit and investment sanctions or the outstanding funded amount, whichever is higher (for term loans, as the
sum of undisbursed commitments and the outstanding amount). Exposure for non-funded facilities is calculated
as 100.0% of the committed amount or the outstanding non-funded amount whichever is higher.
During the year-ended March 31, 2008, we had no single borrower and group borrower which exceeded the
prudential exposure limits prescribed by the Reserve Bank of India.
Management’s Discussion & Analysis
58
ICICI BANK_(Fin_Matter 1-64).ind58 58ICICI BANK_(Fin_Matter 1-64).ind58 58 6/20/08 5:03:14 PM6/20/08 5:03:14 PM