ICICI Bank 2008 Annual Report Download - page 55
Download and view the complete annual report
Please find page 55 of the 2008 ICICI Bank annual report below. You can navigate through the pages in the report by either clicking on the pages listed below, or by using the keyword search tool below to find specific information within the annual report.-
 1
1 -
2
-
3
-
4
-
5
-
6
-
7
-
8
-
9
-
10
-
11
-
12
-
13
-
14
-
15
-
16
-
17
-
18
-
19
-
20
-
21
-
22
-
23
-
24
-
25
-
26
-
27
-
28
-
29
-
30
-
31
-
32
-
33
-
34
-
35
-
36
-
37
-
38
-
39
-
40
-
41
-
42
-
43
-
44
-
 45
45 -
 46
46 -
 47
47 -
 48
48 -
 49
49 -
 50
50 -
 51
51 -
 52
52 -
 53
53 -
 54
54 -
 55
55 -
 56
56 -
 57
57 -
 58
58 -
 59
59 -
 60
60 -
 61
61 -
 62
62 -
 63
63 -
 64
64 -
 65
65 -
66
-
67
-
68
-
69
-
70
-
71
-
72
-
73
-
74
-
75
-
76
-
77
-
78
-
79
-
80
-
81
-
82
-
83
-
84
-
85
-
86
-
87
-
88
-
89
-
90
-
91
-
92
-
93
-
94
-
95
-
96
-
97
-
98
-
99
-
100
-
101
-
102
-
103
-
104
-
105
-
106
-
107
-
108
-
109
-
110
-
111
-
112
-
113
-
114
-
115
-
116
-
117
-
118
-
119
-
120
-
121
-
122
-
123
-
124
-
125
-
126
-
127
-
128
-
129
-
130
-
131
-
132
-
133
-
134
-
135
-
136
-
137
-
138
-
139
-
140
-
141
-
142
-
143
-
144
-
145
-
146
-
147
-
148
-
149
-
150
-
151
-
152
-
153
-
154
-
155
-
156
-
157
-
158
-
159
-
160
-
161
-
162
-
163
-
164
-
165
-
166
-
167
-
168
-
169
-
170
-
171
-
172
-
173
-
174
-
175
-
176
-
177
-
178
-
179
-
180
-
181
-
182
-
183
-
184
-
185
-
186
-
187
-
188
 |
 |

Towards a better life
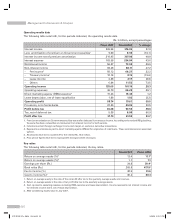
Depreciation on own property increased by 10.9% to Rs. 3.96 billion from Rs. 3.57 billion. There was a 13.4%
increase in premises and other fixed assets to Rs. 33.12 billion at year-end fiscal 2008 from Rs. 29.20 billion at
year-end fiscal 2007. Depreciation on leased assets decreased to Rs. 1.82 billion in fiscal 2008 from Rs. 1.88 billion
in fiscal 2007 primarily due to reduction in leased assets to Rs. 7.97 billion at year-end fiscal 2008 from Rs. 10.03
billion at year-end fiscal 2007.
Other administrative expenses increased by 31.6% to Rs. 39.52 billion in fiscal 2008 from Rs. 30.03 billion in fiscal
2007 primarily due to increase in rent, taxes & lighting expenses and increase in expenses related to retail business.
The number of branches and extension counters in India increased to 1,262 at year-end fiscal 2008 from 755 at
year-end fiscal 2007. ATMs increased to 3,881 at year-end fiscal 2008 from 3,271 at year-end fiscal 2007.
We use marketing agents, called direct marketing agents or associates, for sourcing our retail assets. We include
commissions paid to these direct marketing agents of our retail assets in non-interest expense. These commissions
are expensed upfront and not amortised over the life of the loan. We incurred direct marketing agency expenses
of Rs. 15.43 billion on the retail asset portfolio in fiscal 2008 compared to Rs. 15.24 billion in fiscal 2007.
Provisions and tax
Provisions and contingencies (excluding provision for tax) increased to Rs. 29.05 billion in fiscal 2008 from Rs. 22.26
billion in fiscal 2007 primarily due to higher level of specific provisioning on loans, offset in part by a reduction in
general provision on loans due to lower growth in the loan portfolio relative to fiscal 2007. Specific provisioning
on non-performing loans increased in fiscal 2008 compared to fiscal 2007 primarily due to increase in retail and
rural non-performing loans. The increase in retail non-performing loans primarily reflects the seasoning of the
loan portfolio and the change in the portfolio mix towards non-collateralised retail loans, which have higher yields
as well as higher credit losses.
We offer various derivative products to our clients for their risk management purposes including options and swaps.
We do not carry market risk on these client derivative positions as we cover ourselves in the inter-bank market.
Profits or losses on account of currency movements on these transactions are on the account of corporates. In
some of the cases, clients have filed suits against us disputing the transaction and the amounts to be paid. There
have been some delays in payment to us in respect of few companies. We have made appropriate provisions
for the same.
Income tax expense (including wealth tax) increased by 66.9% to Rs. 8.98 billion in fiscal 2008 from Rs. 5.38
billion in fiscal 2007. The effective tax rate of 17.77% in fiscal 2008 was higher compared to the effective tax rate
of 14.74% in fiscal 2007 primarily due to change in mix of taxable profits, decrease in deduction towards special
reserve from 40% of eligible profits to 20% of eligible profits and the increase in statutory tax rate from 33.66%
to 33.99%.
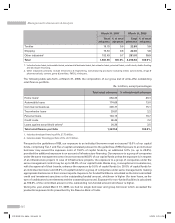
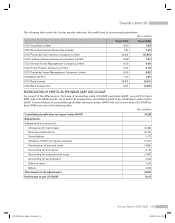
Financial Condition
The following table sets forth, for the periods indicated, the summarised balance sheet.
Rs. in billion, except percentages
March 31,
2007 March 31,
2008 % change
Assets:
Cash, balances with RBI & other banks and Statutory Liquidity
Ratio (SLR) investments1
1,044.89 1,130.72 8.2
– Cash & balances with RBI & banks 371.21 380.41 2.5
– SLR investments1673.68 750.31 11.4
Advances 1,958.66 2,256.16 15.2
Debentures, bonds and other investments 238.90 364.23 52.5
Fixed assets (including leased assets) 39.23 41.09 4.7
Other assets 164.90 205.75 24.8
Total assets 3,446.58 3,997.95 16.0
Annual Report 2007-2008 53
ICICI BANK_(Fin_Matter 1-64).ind53 53ICICI BANK_(Fin_Matter 1-64).ind53 53 6/20/08 5:03:13 PM6/20/08 5:03:13 PM