ICICI Bank 2008 Annual Report Download - page 78
Download and view the complete annual report
Please find page 78 of the 2008 ICICI Bank annual report below. You can navigate through the pages in the report by either clicking on the pages listed below, or by using the keyword search tool below to find specific information within the annual report.-
 1
1 -
2
-
3
-
4
-
5
-
6
-
7
-
8
-
9
-
10
-
11
-
12
-
13
-
14
-
15
-
16
-
17
-
18
-
19
-
20
-
21
-
22
-
23
-
24
-
25
-
26
-
27
-
28
-
29
-
30
-
31
-
32
-
33
-
34
-
35
-
36
-
37
-
38
-
39
-
40
-
41
-
42
-
43
-
44
-
45
-
46
-
47
-
48
-
49
-
50
-
51
-
52
-
53
-
54
-
55
-
56
-
57
-
58
-
59
-
60
-
61
-
62
-
63
-
64
-
65
-
66
-
67
-
 68
68 -
 69
69 -
 70
70 -
 71
71 -
 72
72 -
 73
73 -
 74
74 -
 75
75 -
 76
76 -
 77
77 -
 78
78 -
 79
79 -
 80
80 -
 81
81 -
 82
82 -
 83
83 -
 84
84 -
 85
85 -
 86
86 -
 87
87 -
 88
88 -
89
-
90
-
91
-
92
-
93
-
94
-
95
-
96
-
97
-
98
-
99
-
100
-
101
-
102
-
103
-
104
-
105
-
106
-
107
-
108
-
109
-
110
-
111
-
112
-
113
-
114
-
115
-
116
-
117
-
118
-
119
-
120
-
121
-
122
-
123
-
124
-
125
-
126
-
127
-
128
-
129
-
130
-
131
-
132
-
133
-
134
-
135
-
136
-
137
-
138
-
139
-
140
-
141
-
142
-
143
-
144
-
145
-
146
-
147
-
148
-
149
-
150
-
151
-
152
-
153
-
154
-
155
-
156
-
157
-
158
-
159
-
160
-
161
-
162
-
163
-
164
-
165
-
166
-
167
-
168
-
169
-
170
-
171
-
172
-
173
-
174
-
175
-
176
-
177
-
178
-
179
-
180
-
181
-
182
-
183
-
184
-
185
-
186
-
187
-
188
 |
 |

F4
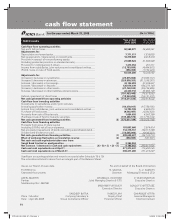
cash flow statement
for the year ended March 31, 2008 (Rs. in ‘000s)
Significant accounting policies and notes to accounts (refer Schedule 18 & 19)
The schedules referred to above form an integral part of the Balance Sheet.
As per our Report of even date. For and on behalf of the Board of Directors
For BSR & Co. N. VAGHUL K. V. KAMATH
Chartered Accountants Chairman Managing Director & CEO
AKEEL MASTER CHANDA D. KOCHHAR V. VAIDYANATHAN
Partner Joint Managing Director & CFO Executive Director
Membership No.: 046768
MADHABI PURI BUCH SONJOY CHATTERJEE
Executive Director Executive Director
SANDEEP BATRA RAKESH JHA CHARANJIT ATTRA
Place : Mumbai Company Secretary & Deputy Chief General Manager &
Date : April 26, 2008 Group Compliance Officer Financial Officer Chief Accountant
PARTICULARS Year ended
31.03.2008 Year ended
31.03.2007
Cash flow from operating activities
Net profit before taxes ........................................................................... 50,560,977 36,480,391
Adjustments for:
Depreciation and amortisation ............................................................... 7,711,011 7,639,002
Net (appreciation) / depreciation on investments.................................. 10,279,608 9,918,419
Provision in respect of non-performing assets
(including prudential provision on standard assets) .............................. 27,009,924 21,592,999
Provision for contingencies & others ..................................................... 1,413,354 251,311
Income from subsidiaries, joint ventures and consolidated entities ..... (12,783,599) (4,484,915)
(Profit) / Loss on sale of fixed assets ..................................................... (656,069) (1,152,224)
83,535,206 70,244,982
Adjustments for:
(Increase) / decrease in investments ..................................................... (25,015,908) (19,666,157)
(Increase) / decrease in advances .......................................................... (320,850,355) (511,255,267)
Increase / (decrease) in borrowings ....................................................... 43,122,293 57,039,927
Increase / (decrease) in deposits ........................................................... 126,079,339 654,270,149
(Increase) / decrease in other assets ..................................................... (27,149,533) (28,758,999)
Increase / (decrease) in other liabilities and provisions ......................... 22,330,716 26,886,199
(181,483,448) 178,515,852
Refund / (payment) of direct taxes ........................................................ (18,363,292) (18,141,312)
Net cash generated from operating activities
(A)
(116,311,534) 230,619,522
Cash flow from investing activities
Investments in subsidiaries and/or joint ventures
(including application money) ................................................................ (44,379,917) (15,758,166)
Income from subsidiaries, joint ventures and consolidated entities ..... 12,783,799 4,484,915
Purchase of fixed assets ........................................................................ (9,592,487) (4,924,623)
Proceeds from sale of fixed assets ....................................................... 1,064,035 4,347,300
(Purchase) / sale of held to maturity securities ..................................... (135,486,579) (171,776,134)
Net cash generated from investing activities
(B)
(175,611,149) (183,626,708)
Cash flow from financing activities
Proceeds from issue of share capital
(including ESOPs) net of issue expenses .............................................. 197,897,060 2,074,414
Net proceeds / (repayment) of bonds (including subordinated debt) ... 112,316,167 160,717,380
Dividend and dividend tax paid .............................................................. (10,565,000) (8,646,021)
Net cash generated from financing activities.....................................
(C)
299,648,227 154,145,774
Effect of exchange fluctuation on translation reserve .......................
(D)
(890,065) (327,587)
Net cash and cash equivalents taken over from
Sangli Bank Limited on amalgamation ...............................................
(E)
2,362,563 —
Net increase / (decrease) in cash and cash equivalents ....................
(A) + (B) + (C) + (D) + (E)
9,198,042 200,811,001
Cash and cash equivalents as at April 1 ............................................. 371,213,247 170,402,245
Cash and cash equivalents as at March 31 ......................................... 380,411,289 371,213,247
ICICI_BK_AR_2008_(F1_F46).indd 4ICICI_BK_AR_2008_(F1_F46).indd 4 6/20/08 3:24:04 PM6/20/08 3:24:04 PM