ICICI Bank 2008 Annual Report Download - page 28
Download and view the complete annual report
Please find page 28 of the 2008 ICICI Bank annual report below. You can navigate through the pages in the report by either clicking on the pages listed below, or by using the keyword search tool below to find specific information within the annual report.-
 1
1 -
2
-
3
-
4
-
5
-
6
-
7
-
8
-
9
-
10
-
11
-
12
-
13
-
14
-
15
-
16
-
17
-
 18
18 -
 19
19 -
 20
20 -
 21
21 -
 22
22 -
 23
23 -
 24
24 -
 25
25 -
 26
26 -
 27
27 -
 28
28 -
 29
29 -
 30
30 -
 31
31 -
 32
32 -
 33
33 -
 34
34 -
 35
35 -
 36
36 -
 37
37 -
 38
38 -
39
-
40
-
41
-
42
-
43
-
44
-
45
-
46
-
47
-
48
-
49
-
50
-
51
-
52
-
53
-
54
-
55
-
56
-
57
-
58
-
59
-
60
-
61
-
62
-
63
-
64
-
65
-
66
-
67
-
68
-
69
-
70
-
71
-
72
-
73
-
74
-
75
-
76
-
77
-
78
-
79
-
80
-
81
-
82
-
83
-
84
-
85
-
86
-
87
-
88
-
89
-
90
-
91
-
92
-
93
-
94
-
95
-
96
-
97
-
98
-
99
-
100
-
101
-
102
-
103
-
104
-
105
-
106
-
107
-
108
-
109
-
110
-
111
-
112
-
113
-
114
-
115
-
116
-
117
-
118
-
119
-
120
-
121
-
122
-
123
-
124
-
125
-
126
-
127
-
128
-
129
-
130
-
131
-
132
-
133
-
134
-
135
-
136
-
137
-
138
-
139
-
140
-
141
-
142
-
143
-
144
-
145
-
146
-
147
-
148
-
149
-
150
-
151
-
152
-
153
-
154
-
155
-
156
-
157
-
158
-
159
-
160
-
161
-
162
-
163
-
164
-
165
-
166
-
167
-
168
-
169
-
170
-
171
-
172
-
173
-
174
-
175
-
176
-
177
-
178
-
179
-
180
-
181
-
182
-
183
-
184
-
185
-
186
-
187
-
188
 |
 |

Directors’ Report
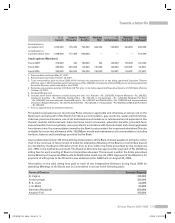
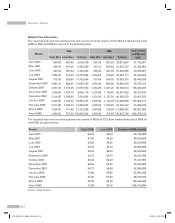
Market Price Information
The reported high and low closing prices and volume of equity shares of ICICI Bank traded during fiscal
2008 on BSE and NSE are set out in the following table:
Month BSE NSE Total volume
on BSE and
NSE
High (Rs.) Low (Rs.) Volume High (Rs.) Low (Rs.) Volume
April 2007 964.05 803.95 5,918,780 962.90 803.95 25,873,887 31,792,667
May 2007 950.70 841.45 6,362,826 951.15 839.80 31,075,227 37,438,053
June 2007 955.30 901.90 6,102,036 955.45 901.95 23,363,845 29,465,881
July 2007 1,005.40 914.25 15,778,582 1,003.65 914.40 39,952,111 55,730,693
August 2007 915.30 825.80 17,763,584 915.50 824.70 70,683,251 88,446,835
September 2007 1,063.15 883.85 13,045,167 1,062.40 884.05 57,686,954 70,732,121
October 2007 1,257.00 1,016.35 21,577,524 1,254.05 1,021.20 86,748,513 108,326,037
November 2007 1,330.60 1,103.10 8,926,110 1,333.40 1,106.45 60,241,422 69,167,532
December 2007 1,316.05 1,140.40 7,474,505 1,314.30 1,137.70 46,393,370 53,867,875
January 2008 1,439.90 1,124.75 22,083,411 1,435.00 1,124.95 112,998,800 135,082,211
February 2008 1,217.80 1,035.70 13,258,521 1,220.20 1,033.85 59,745,757 73,004,278
March 2008 1,024.45 757.40 27,312,288 1,024.60 759.95 111,889,662 139,201,950
Fiscal 2008 1,439.90 757.40 165,603,334 1,435.00 759.95 726,652,799 892,256,133
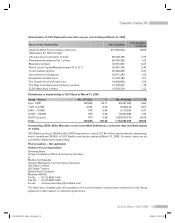
The reported high and low closing prices and volume of ADSs of ICICI Bank traded during fiscal 2008 on
the NYSE are given below:
Month High (US$) Low (US$) Number of ADSs traded
April 2007 46.52 36.53 40,198,000
May 2007 47.89 40.29 45,520,000
June 2007 49.69 45.96 39,229,400
July 2007 53.23 44.16 49,085,800
August 2007 44.73 38.03 48,243,600
September 2007 52.72 43.79 36,541,500
October 2007 69.44 52.43 75,127,900
November 2007 68.95 55.29 59,238,000
December 2007 64.71 56.90 36,384,200
January 2008 72.88 59.06 67,696,300
February 2008 62.26 51.84 48,910,700
March 2008 50.28 35.16 103,244,400
Fiscal 2008 72.88 35.16 649,419,800
Source: Yahoo Finance
26
ICICI BANK_(Fin_Matter 1-64).ind26 26ICICI BANK_(Fin_Matter 1-64).ind26 26 6/20/08 5:03:02 PM6/20/08 5:03:02 PM