Tyson Foods 2014 Annual Report Download - page 98
Download and view the complete annual report
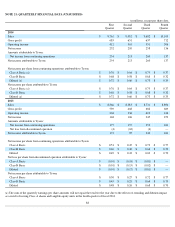
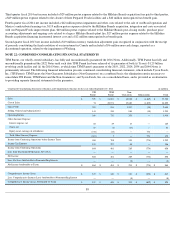
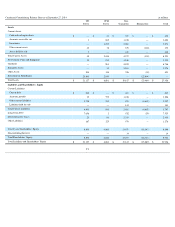
Please find page 98 of the 2014 Tyson Foods annual report below. You can navigate through the pages in the report by either clicking on the pages listed below, or by using the keyword search tool below to find specific information within the annual report.-
 1
1 -
2
-
3
-
4
-
5
-
6
-
7
-
8
-
9
-
10
-
11
-
12
-
13
-
14
-
15
-
16
-
17
-
18
-
19
-
20
-
21
-
22
-
23
-
24
-
25
-
26
-
27
-
28
-
29
-
30
-
31
-
32
-
33
-
34
-
35
-
36
-
37
-
38
-
39
-
40
-
41
-
42
-
43
-
44
-
45
-
46
-
47
-
48
-
49
-
50
-
51
-
52
-
53
-
54
-
55
-
56
-
57
-
58
-
59
-
60
-
61
-
62
-
63
-
64
-
65
-
66
-
67
-
68
-
69
-
70
-
71
-
72
-
73
-
74
-
75
-
76
-
77
-
78
-
79
-
80
-
81
-
82
-
83
-
84
-
85
-
86
-
87
-
 88
88 -
 89
89 -
 90
90 -
 91
91 -
 92
92 -
 93
93 -
 94
94 -
 95
95 -
 96
96 -
 97
97 -
 98
98 -
 99
99 -
 100
100 -
 101
101 -
 102
102 -
 103
103 -
 104
104 -
 105
105 -
 106
106 -
 107
107 -
 108
108 -
109
-
110
-
111
-
112
-
113
-
114
-
115
-
116
-
117
-
118
-
119
-
120
-
121
-
122
-
123
-
124
-
125
-
126
-
127
-
128
-
129
-
130
-
131
-
132
-
133
-
134
-
135
-
136
-
137
-
138
-
139
-
140
-
141
-
142
-
143
-
144
-
145
-
146
-
147
-
148
-
149
-
150
-
151
-
152
-
153
-
154
-
155
-
156
-
157
-
158
-
159
-
160
-
161
-
162
-
163
-
164
-
165
-
166
-
167
-
168
-
169
-
170
-
171
-
172
-
173
-
174
-
175
-
176
-
177
-
178
-
179
-
180
-
181
-
182
-
183
-
184
-
185
-
186
-
187
-
188
-
189
-
190
-
191
-
192
-
193
-
194
-
195
-
196
-
197
-
198
-
199
-
200
-
201
-
202
-
203
-
204
-
205
-
206
-
207
-
208
-
209
-
210
-
211
-
212
-
213
-
214
-
215
-
216
-
217
-
218
-
219
-
220
-
221
-
222
-
223
-
224
-
225
-
226
-
227
-
228
 |
 |
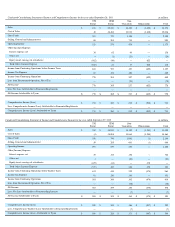
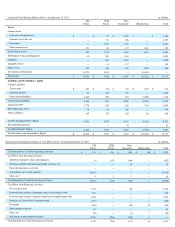
Condensed Consolidating Statement of Income and Comprehensive Income for the year ended September 28, 2013
in millions
TFI
Parent
TFM
Parent
Non-
Guarantors
Eliminations
Total
Sales
$
431
$
19,243
$
16,120
$
(1,420
)
$
34,374
Cost of Sales
40
18,464
14,932
(1,420
)
32,016
Gross Profit
391
779
1,188
—
2,358
Selling, General and Administrative
68
201
714
—
983
Operating Income
323
578
474
—
1,375
Other (Income) Expense:
Interest expense, net
36
62
40
—
138
Other, net
4
(1
)
(23
)
—
(
20
)
Equity in net earnings of subsidiaries
(582
)
(40
)
—
622
—
Total Other (Income) Expense
(542
)
21
17
622
118
Income from Continuing Operations before Income Taxes
865
557
457
(622
)
1,257
Income Tax Expense
87
172
150
—
409
Income from Continuing Operations
778
385
307
(622
)
848
Loss from Discontinued Operation, Net of Tax —
—
(
70
)
—
(
70
)
Net Income
778
385
237
(622
)
778
Less: Net Loss Attributable to Noncontrolling Interests —
—
—
—
—
Net Income Attributable to Tyson
$
778
$
385
$
237
$
(622
)
$
778
Comprehensive Income (Loss)
$
733
$
380
$
212
$
(592
)
$
733
Less: Comprehensive Income (Loss) Attributable to Noncontrolling Interests —
—
—
—
—
Comprehensive Income (Loss) Attributable to Tyson
$
733
$
380
$
212
$
(592
)
$
733
Condensed Consolidating Statement of Income and Comprehensive Income for the year ended September 29, 2012
in millions
TFI
Parent
TFM
Parent
Non-
Guarantors
Eliminations
Total
Sales
$
352
$
18,832
$
15,152
$
(1,281
)
$
33,055
Cost of Sales
(4
)
18,088
14,061
(1,280
)
30,865
Gross Profit
356
744
1,091
(1
)
2,190
Selling, General and Administrative
59
205
641
(1
)
904
Operating Income
297
539
450
—
1,286
Other (Income) Expense:
Interest expense, net
49
143
152
—
344
Other, net
1
—
(
24
)
—
(
23
)
Equity in net earnings of subsidiaries
(427
)
(43
)
—
470
—
Total Other (Income) Expense
(377
)
100
128
470
321
Income from Continuing Operations before Income Taxes
674
439
322
(470
)
965
Income Tax Expense
91
130
130
—
351
Income from Continuing Operations
583
309
192
(470
)
614
Loss from Discontinued Operation, Net of Tax —
—
(
38
)
—
(
38
)
Net Income
583
309
154
(470
)
576
Less: Net Loss Attributable to Noncontrolling Interests —
—
(
7
)
—
(
7
)
Net Income Attributable to Tyson
$
583
$
309
$
161
$
(470
)
$
583
Comprehensive Income (Loss)
$
599
$
324
$
166
$
(497
)
$
592
Less: Comprehensive Income (Loss) Attributable to Noncontrolling Interests —
—
(
7
)
—
(
7
)
Comprehensive Income (Loss) Attributable to Tyson
$
599
$
324
$
173
$
(497
)
$
599