Tyson Foods 2014 Annual Report Download - page 96
Download and view the complete annual report
Please find page 96 of the 2014 Tyson Foods annual report below. You can navigate through the pages in the report by either clicking on the pages listed below, or by using the keyword search tool below to find specific information within the annual report.-
 1
1 -
2
-
3
-
4
-
5
-
6
-
7
-
8
-
9
-
10
-
11
-
12
-
13
-
14
-
15
-
16
-
17
-
18
-
19
-
20
-
21
-
22
-
23
-
24
-
25
-
26
-
27
-
28
-
29
-
30
-
31
-
32
-
33
-
34
-
35
-
36
-
37
-
38
-
39
-
40
-
41
-
42
-
43
-
44
-
45
-
46
-
47
-
48
-
49
-
50
-
51
-
52
-
53
-
54
-
55
-
56
-
57
-
58
-
59
-
60
-
61
-
62
-
63
-
64
-
65
-
66
-
67
-
68
-
69
-
70
-
71
-
72
-
73
-
74
-
75
-
76
-
77
-
78
-
79
-
80
-
81
-
82
-
83
-
84
-
85
-
 86
86 -
 87
87 -
 88
88 -
 89
89 -
 90
90 -
 91
91 -
 92
92 -
 93
93 -
 94
94 -
 95
95 -
 96
96 -
 97
97 -
 98
98 -
 99
99 -
 100
100 -
 101
101 -
 102
102 -
 103
103 -
 104
104 -
 105
105 -
 106
106 -
107
-
108
-
109
-
110
-
111
-
112
-
113
-
114
-
115
-
116
-
117
-
118
-
119
-
120
-
121
-
122
-
123
-
124
-
125
-
126
-
127
-
128
-
129
-
130
-
131
-
132
-
133
-
134
-
135
-
136
-
137
-
138
-
139
-
140
-
141
-
142
-
143
-
144
-
145
-
146
-
147
-
148
-
149
-
150
-
151
-
152
-
153
-
154
-
155
-
156
-
157
-
158
-
159
-
160
-
161
-
162
-
163
-
164
-
165
-
166
-
167
-
168
-
169
-
170
-
171
-
172
-
173
-
174
-
175
-
176
-
177
-
178
-
179
-
180
-
181
-
182
-
183
-
184
-
185
-
186
-
187
-
188
-
189
-
190
-
191
-
192
-
193
-
194
-
195
-
196
-
197
-
198
-
199
-
200
-
201
-
202
-
203
-
204
-
205
-
206
-
207
-
208
-
209
-
210
-
211
-
212
-
213
-
214
-
215
-
216
-
217
-
218
-
219
-
220
-
221
-
222
-
223
-
224
-
225
-
226
-
227
-
228
 |
 |
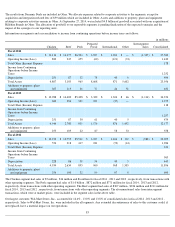
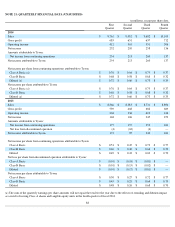
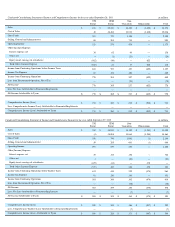
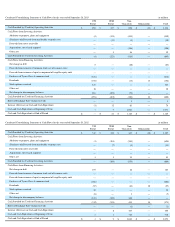
NOTE 21: QUARTERLY FINANCIAL DATA (UNAUDITED)
(a) The sum of the quarterly earnings per share amounts will not equal the total for the year due to the effects of rounding and dilution impact
as a result of issuing Class A shares and tangible equity units in the fourth quarter of fiscal 2014.
88
in millions, except per share data
First
Quarter
Second
Quarter
Third
Quarter
Fourth
Quarter
2014
Sales
$
8,761
$
9,032
$
9,682
$
10,105
Gross profit
685
651
637
712
Operating income
412
361
351
306
Net income
252
210
258
136
Amounts attributable to Tyson:
Net income from continuing operations
254
213
260
137
Net income attributable to Tyson
254
213
260
137
Net income per share from continuing operations attributable to Tyson:
Class A Basic (a)
$
0.76
$
0.64
$
0.75
$
0.37
Class B Basic
$
0.68
$
0.58
$
0.68
$
0.32
Diluted (a)
$
0.72
$
0.60
$
0.73
$
0.35
Net income per share attributable to Tyson:
Class A Basic (a)
$
0.76
$
0.64
$
0.75
$
0.37
Class B Basic
$
0.68
$
0.58
$
0.68
$
0.32
Diluted (a)
$
0.72
$
0.60
$
0.73
$
0.35
2013
Sales
$
8,366
$
8,383
$
8,731
$
8,894
Gross profit
539
468
682
669
Operating income
304
236
419
416
Net income
168
106
245
259
Amounts attributable to Tyson:
Net income from continuing operations
177
157
253
261
Net loss from discontinued operation
(4
)
(62
)
(4
)
—
Net income attributable to Tyson
173
95
249
261
Net income per share from continuing operations attributable to Tyson:
Class A Basic
$
0.51
$
0.45
$
0.73
$
0.77
Class B Basic
$
0.46
$
0.40
$
0.66
$
0.70
Diluted
$
0.49
$
0.43
$
0.69
$
0.70
Net loss per share from discontinued operation attributable to Tyson:
Class A Basic
$
(0.01
)
$
(0.18
)
$
(0.01
)
$
—
Class B Basic
$
(0.01
)
$
(0.15
)
$
(0.02
)
$
—
Diluted
$
(0.01
)
$
(0.17
)
$
(0.01
)
$
—
Net income per share attributable to Tyson:
Class A Basic
$
0.50
$
0.27
$
0.72
$
0.77
Class B Basic
$
0.45
$
0.25
$
0.64
$
0.70
Diluted
$
0.48
$
0.26
$
0.68
$
0.70