Tyson Foods 2014 Annual Report Download - page 101
Download and view the complete annual report
Please find page 101 of the 2014 Tyson Foods annual report below. You can navigate through the pages in the report by either clicking on the pages listed below, or by using the keyword search tool below to find specific information within the annual report.-
 1
1 -
2
-
3
-
4
-
5
-
6
-
7
-
8
-
9
-
10
-
11
-
12
-
13
-
14
-
15
-
16
-
17
-
18
-
19
-
20
-
21
-
22
-
23
-
24
-
25
-
26
-
27
-
28
-
29
-
30
-
31
-
32
-
33
-
34
-
35
-
36
-
37
-
38
-
39
-
40
-
41
-
42
-
43
-
44
-
45
-
46
-
47
-
48
-
49
-
50
-
51
-
52
-
53
-
54
-
55
-
56
-
57
-
58
-
59
-
60
-
61
-
62
-
63
-
64
-
65
-
66
-
67
-
68
-
69
-
70
-
71
-
72
-
73
-
74
-
75
-
76
-
77
-
78
-
79
-
80
-
81
-
82
-
83
-
84
-
85
-
86
-
87
-
88
-
89
-
90
-
 91
91 -
 92
92 -
 93
93 -
 94
94 -
 95
95 -
 96
96 -
 97
97 -
 98
98 -
 99
99 -
 100
100 -
 101
101 -
 102
102 -
 103
103 -
 104
104 -
 105
105 -
 106
106 -
 107
107 -
 108
108 -
 109
109 -
 110
110 -
 111
111 -
112
-
113
-
114
-
115
-
116
-
117
-
118
-
119
-
120
-
121
-
122
-
123
-
124
-
125
-
126
-
127
-
128
-
129
-
130
-
131
-
132
-
133
-
134
-
135
-
136
-
137
-
138
-
139
-
140
-
141
-
142
-
143
-
144
-
145
-
146
-
147
-
148
-
149
-
150
-
151
-
152
-
153
-
154
-
155
-
156
-
157
-
158
-
159
-
160
-
161
-
162
-
163
-
164
-
165
-
166
-
167
-
168
-
169
-
170
-
171
-
172
-
173
-
174
-
175
-
176
-
177
-
178
-
179
-
180
-
181
-
182
-
183
-
184
-
185
-
186
-
187
-
188
-
189
-
190
-
191
-
192
-
193
-
194
-
195
-
196
-
197
-
198
-
199
-
200
-
201
-
202
-
203
-
204
-
205
-
206
-
207
-
208
-
209
-
210
-
211
-
212
-
213
-
214
-
215
-
216
-
217
-
218
-
219
-
220
-
221
-
222
-
223
-
224
-
225
-
226
-
227
-
228
 |
 |
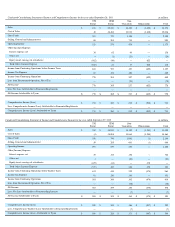
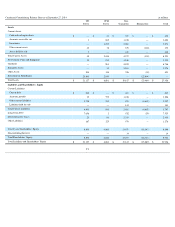
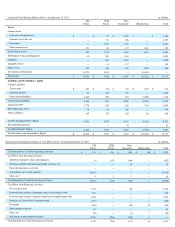
Condensed Consolidating Balance Sheet as of September 28, 2013
in millions
TFI
Parent
TFM
Parent
Non-
Guarantors
Eliminations
Total
Assets
Current Assets:
Cash and cash equivalents
$
—
$
21
$
1,124
$
—
$
1,145
Accounts receivable, net —
571
926
—
1,497
Inventories —
1,039
1,778
—
2,817
Other current assets
351
88
117
(411
)
145
Total Current Assets
351
1,719
3,945
(411
)
5,604
Net Property, Plant and Equipment
32
891
3,130
—
4,053
Goodwill —
881
1,021
—
1,902
Intangible Assets —
21
117
—
138
Other Assets
895
162
244
(821
)
480
Investment in Subsidiaries
11,975
2,035
—
(
14,010
)
—
Total Assets
$
13,253
$
5,709
$
8,457
$
(15,242
)
$
12,177
Liabilities and Shareholders’ Equity
Current Liabilities:
Current debt
$
457
$
132
$
251
$
(327
)
$
513
Accounts payable
27
575
757
—
1,359
Other current liabilities
4,625
200
901
(4,588
)
1,138
Total Current Liabilities
5,109
907
1,909
(4,915
)
3,010
Long-Term Debt
1,770
679
241
(795
)
1,895
Deferred Income Taxes
24
93
362
—
479
Other Liabilities
149
155
282
(26
)
560
Total Tyson Shareholders’ Equity
6,201
3,875
5,631
(9,506
)
6,201
Noncontrolling Interests —
—
32
—
32
Total Shareholders’ Equity
6,201
3,875
5,663
(9,506
)
6,233
Total Liabilities and Shareholders’ Equity
$
13,253
$
5,709
$
8,457
$
(15,242
)
$
12,177
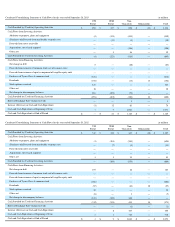
Condensed Consolidating Statement of Cash Flows for the year ended September 27, 2014
in millions
TFI
Parent
TFM
Parent
Non-
Guarantors
Eliminations
Total
Cash Provided by (Used for) Operating Activities
$
132
$
431
$
660
$
(45
)
$
1,178
Cash Flows from Investing Activities:
Additions to property, plant and equipment
(1
)
(147
)
(484
)
—
(
632
)
(Purchases of)/Proceeds from marketable securities, net —
—
15
—
15
Proceeds from notes receivable —
—
—
—
—
Acquisitions, net of cash acquired
(8,193
)
—
—
—
(
8,193
)
Other, net
5
2
3
—
10
Cash Provided by (Used for) Investing Activities
(8,189
)
(145
)
(466
)
—
(
8,800
)
Cash Flows from Financing Activities:
Net change in debt
5,154
—
(
12
)
—
5,142
Proceeds from issuance of common stock, net of issuance costs
873
—
—
—
873
Proceeds from issuance of equity component of tangible equity units
1,255
—
—
—
1,255
Purchases of Tyson Class A common stock
(295
)
—
—
—
(
295
)
Dividends
(104
)
—
(
45
)
45
(104
)
Stock options exercised
67
—
—
—
67
Other, net
(22
)
—
(
1
)
—
(
23
)
Net change in intercompany balances
1,129
(266
)
(863
)
—
—
Cash Provided by (Used for) Financing Activities
8,057
(266
)
(921
)
45
6,915