Tyson Foods 2014 Annual Report Download - page 25
Download and view the complete annual report
Please find page 25 of the 2014 Tyson Foods annual report below. You can navigate through the pages in the report by either clicking on the pages listed below, or by using the keyword search tool below to find specific information within the annual report.-
 1
1 -
2
-
3
-
4
-
5
-
6
-
7
-
8
-
9
-
10
-
11
-
12
-
13
-
14
-
 15
15 -
 16
16 -
 17
17 -
 18
18 -
 19
19 -
 20
20 -
 21
21 -
 22
22 -
 23
23 -
 24
24 -
 25
25 -
 26
26 -
 27
27 -
 28
28 -
 29
29 -
 30
30 -
 31
31 -
 32
32 -
 33
33 -
 34
34 -
 35
35 -
36
-
37
-
38
-
39
-
40
-
41
-
42
-
43
-
44
-
45
-
46
-
47
-
48
-
49
-
50
-
51
-
52
-
53
-
54
-
55
-
56
-
57
-
58
-
59
-
60
-
61
-
62
-
63
-
64
-
65
-
66
-
67
-
68
-
69
-
70
-
71
-
72
-
73
-
74
-
75
-
76
-
77
-
78
-
79
-
80
-
81
-
82
-
83
-
84
-
85
-
86
-
87
-
88
-
89
-
90
-
91
-
92
-
93
-
94
-
95
-
96
-
97
-
98
-
99
-
100
-
101
-
102
-
103
-
104
-
105
-
106
-
107
-
108
-
109
-
110
-
111
-
112
-
113
-
114
-
115
-
116
-
117
-
118
-
119
-
120
-
121
-
122
-
123
-
124
-
125
-
126
-
127
-
128
-
129
-
130
-
131
-
132
-
133
-
134
-
135
-
136
-
137
-
138
-
139
-
140
-
141
-
142
-
143
-
144
-
145
-
146
-
147
-
148
-
149
-
150
-
151
-
152
-
153
-
154
-
155
-
156
-
157
-
158
-
159
-
160
-
161
-
162
-
163
-
164
-
165
-
166
-
167
-
168
-
169
-
170
-
171
-
172
-
173
-
174
-
175
-
176
-
177
-
178
-
179
-
180
-
181
-
182
-
183
-
184
-
185
-
186
-
187
-
188
-
189
-
190
-
191
-
192
-
193
-
194
-
195
-
196
-
197
-
198
-
199
-
200
-
201
-
202
-
203
-
204
-
205
-
206
-
207
-
208
-
209
-
210
-
211
-
212
-
213
-
214
-
215
-
216
-
217
-
218
-
219
-
220
-
221
-
222
-
223
-
224
-
225
-
226
-
227
-
228
 |
 |

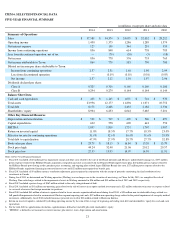
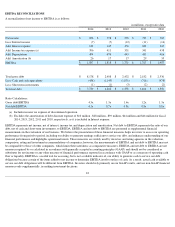
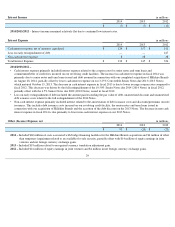
EBITDA RECONCILIATIONS
A reconciliation of net income to EBITDA is as follows:
EBITDA represents net income, net of interest, income tax and depreciation and amortization. Net debt to EBITDA represents the ratio of our
debt, net of cash and short-term investments, to EBITDA. EBITDA and net debt to EBITDA are presented as supplemental financial
measurements in the evaluation of our business. We believe the presentation of these financial measures helps investors to assess our operating
performance from period to period, including our ability to generate earnings sufficient to service our debt, and enhances understanding of our
financial performance and highlights operational trends. These measures are widely used by investors and rating agencies in the valuation,
comparison, rating and investment recommendations of companies; however, the measurements of EBITDA and net debt to EBITDA may not
be comparable to those of other companies, which limits their usefulness as comparative measures. EBITDA and net debt to EBITDA are not
measures required by or calculated in accordance with generally accepted accounting principles (GAAP) and should not be considered as
substitutes for net income or any other measure of financial performance reported in accordance with GAAP or as a measure of operating cash
flow or liquidity. EBITDA is a useful tool for assessing, but is not a reliable indicator of, our ability to generate cash to service our debt
obligations because certain of the items added to net income to determine EBITDA involve outlays of cash. As a result, actual cash available to
service our debt obligations will be different from EBITDA. Investors should rely primarily on our GAAP results, and use non-
GAAP financial
measures only supplementally, in making investment decisions.
22
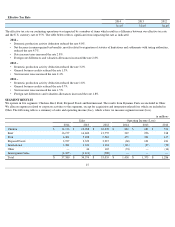
in millions, except ratio data
2014
2013
2012
2011
2010
Net income
$
856
$
778
$
576
$
733
$
765
Less: Interest income
(7
)
(7
)
(12
)
(11
)
(14
)
Add: Interest expense
132
145
356
242
347
Add: Income tax expense (a)
396
411
351
341
438
Add: Depreciation
494
474
443
433
416
Add: Amortization (b)
26
17
17
29
35
EBITDA
$
1,897
$
1,818
$
1,731
$
1,767
$
1,987
Total gross debt
$
8,178
$
2,408
$
2,432
$
2,182
$
2,536
Less: Cash and cash equivalents
(438
)
(1,145
)
(1,071
)
(716
)
(978
)
Less: Short-term investments
(1
)
(1
)
(3
)
(2
)
(2
)
Total net debt
$
7,739
$
1,262
$
1,358
$
1,464
$
1,556
Ratio Calculations:
Gross debt/EBITDA
4.3x
1.3x
1.4x
1.2x
1.3x
Net debt/EBITDA
4.1x
0.7x
0.8x
0.8x
0.8x
(a)
Includes income tax expense of discontinued operation.
(b) Excludes the amortization of debt discount expense of $10 million , $28 million , $39 million, $44 million and $46 million for fiscal
2014, 2013, 2012, 2011 and 2010, respectively, as it is included in Interest expense.