Tyson Foods 2014 Annual Report Download - page 85
Download and view the complete annual report
Please find page 85 of the 2014 Tyson Foods annual report below. You can navigate through the pages in the report by either clicking on the pages listed below, or by using the keyword search tool below to find specific information within the annual report.-
 1
1 -
2
-
3
-
4
-
5
-
6
-
7
-
8
-
9
-
10
-
11
-
12
-
13
-
14
-
15
-
16
-
17
-
18
-
19
-
20
-
21
-
22
-
23
-
24
-
25
-
26
-
27
-
28
-
29
-
30
-
31
-
32
-
33
-
34
-
35
-
36
-
37
-
38
-
39
-
40
-
41
-
42
-
43
-
44
-
45
-
46
-
47
-
48
-
49
-
50
-
51
-
52
-
53
-
54
-
55
-
56
-
57
-
58
-
59
-
60
-
61
-
62
-
63
-
64
-
65
-
66
-
67
-
68
-
69
-
70
-
71
-
72
-
73
-
74
-
 75
75 -
 76
76 -
 77
77 -
 78
78 -
 79
79 -
 80
80 -
 81
81 -
 82
82 -
 83
83 -
 84
84 -
 85
85 -
 86
86 -
 87
87 -
 88
88 -
 89
89 -
 90
90 -
 91
91 -
 92
92 -
 93
93 -
 94
94 -
 95
95 -
96
-
97
-
98
-
99
-
100
-
101
-
102
-
103
-
104
-
105
-
106
-
107
-
108
-
109
-
110
-
111
-
112
-
113
-
114
-
115
-
116
-
117
-
118
-
119
-
120
-
121
-
122
-
123
-
124
-
125
-
126
-
127
-
128
-
129
-
130
-
131
-
132
-
133
-
134
-
135
-
136
-
137
-
138
-
139
-
140
-
141
-
142
-
143
-
144
-
145
-
146
-
147
-
148
-
149
-
150
-
151
-
152
-
153
-
154
-
155
-
156
-
157
-
158
-
159
-
160
-
161
-
162
-
163
-
164
-
165
-
166
-
167
-
168
-
169
-
170
-
171
-
172
-
173
-
174
-
175
-
176
-
177
-
178
-
179
-
180
-
181
-
182
-
183
-
184
-
185
-
186
-
187
-
188
-
189
-
190
-
191
-
192
-
193
-
194
-
195
-
196
-
197
-
198
-
199
-
200
-
201
-
202
-
203
-
204
-
205
-
206
-
207
-
208
-
209
-
210
-
211
-
212
-
213
-
214
-
215
-
216
-
217
-
218
-
219
-
220
-
221
-
222
-
223
-
224
-
225
-
226
-
227
-
228
 |
 |

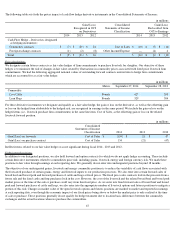
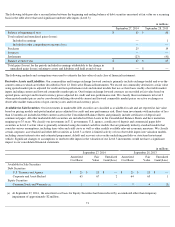
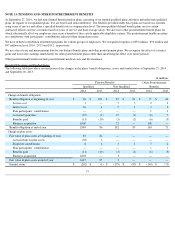
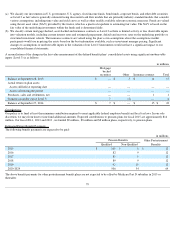
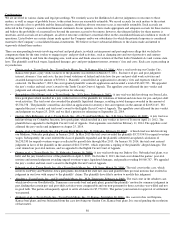
Assumptions
Weighted average assumptions are as follows:
To determine the expected return on plan assets assumption, we first examined historical rates of return for the various asset classes within the
plans. We then determined a long-term projected rate-of-return based on expected returns.
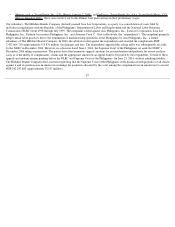
Our discount rate assumptions used to account for pension and other postretirement benefit plans reflect the rates at which the benefit
obligations could be effectively settled. These were determined using a cash flow matching technique whereby the rates of a yield curve,
developed from high-
quality debt securities, were applied to the benefit obligations to determine the appropriate discount rate. As of September
27, 2014, all pension and other postretirement benefit plans used the RP-2014 mortality tables. At September 28, 2013, the pension plans used
the 2013 IRS mortality tables while the other postretirement benefit plans used either the RP-2000 or the 2013 IRS mortality tables to align
with applicable participant data.
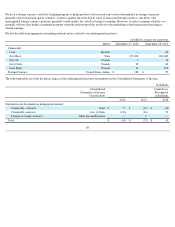
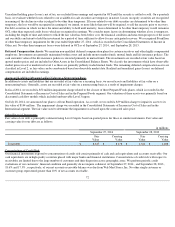
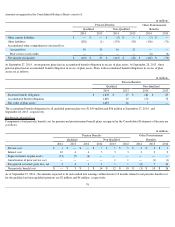
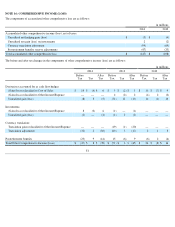
We have six other postretirement benefit plans which are healthcare and life insurance related. Two of these plans, which benefit obligations
totaled $22 million at September 27, 2014 , were not impacted by healthcare cost trend rates as they consist of fixed annual payments. The
remaining plans, which benefit obligations were $141 million at September 27, 2014 , covering retirees who do not yet qualify for Medicare
utilized an assumed healthcare cost trend rate of 7.3% and those covering retirees who do qualify for Medicare utilized an assumed healthcare
cost trend of 6.5% . The healthcare cost trend rate will be grading down to an ultimate rate of 5.0% in 2021/2022. A one-percentage-point
change in assumed health-care cost trend rates would have the following effects:
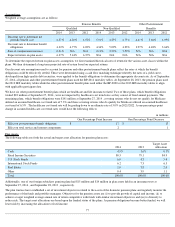
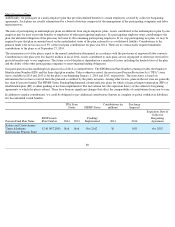
Plan Assets
The following table sets forth the actual and target asset allocation for pension plan assets:
Additionally, one of our foreign subsidiary pension plans had $15 million and $14 million in plan assets held in an insurance trust at
September 27, 2014 , and September 28, 2013 , respectively.
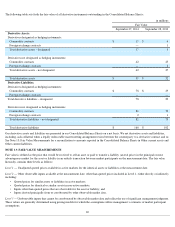
The plan trustees have established a set of investment objectives related to the assets of the domestic pension plans and regularly monitor the
performance of the funds and portfolio managers. Objectives for the pension assets are (i) to provide growth of capital and income, (ii) to
achieve a target weighted average annual rate of return competitive with funds with similar investment objectives and (iii) to diversify to
reduce risk. The target asset allocations are based upon the funded status of the plans. As pension obligations become better funded, we will
lower risk by increasing the allocation to fixed income.
77
Pension Benefits
Other Postretirement
Qualified
Non-Qualified
Benefits
2014
2013
2012
2014
2013
2012
2014
2013
2012
Discount rate to determine net
periodic benefit cost
4.37
%
4.02
%
4.53
%
5.01
%
4.23
%
4.75
%
4.41
%
3.66
%
4.09
%
Discount rate to determine benefit
obligations
4.32
%
4.77
%
4.02
%
4.36
%
5.09
%
4.23
%
3.97
%
4.48
%
3.66
%
Rate of compensation increase
0.01
%
N/A
N/A
2.11
%
3.50
%
3.50
%
N/A
N/A
N/A
Expected return on plan assets
6.37
%
5.44
%
6.37
%
N/A
N/A
N/A
N/A
N/A
N/A
in millions
One Percentage Point Increase
One Percentage Point Decrease
Effect on postretirement benefit obligation
$
17
$
13
Effect on total service and interest components
2
1
2014
2013
Target Asset
Allocation
Cash
4.9
%
1.6
%
0.3
%
Fixed Income Securities
80.5
79.1
84.9
U.S. Stock Funds
6.0
4.3
5.4
International Stock Funds
6.2
7.3
6.3
Real Estate
2.0
3.8
2.0
Other
0.4
3.9
1.1
Total
100.0
%
100.0
%
100.0
%