Tyson Foods 2014 Annual Report Download - page 71
Download and view the complete annual report
Please find page 71 of the 2014 Tyson Foods annual report below. You can navigate through the pages in the report by either clicking on the pages listed below, or by using the keyword search tool below to find specific information within the annual report.-
 1
1 -
2
-
3
-
4
-
5
-
6
-
7
-
8
-
9
-
10
-
11
-
12
-
13
-
14
-
15
-
16
-
17
-
18
-
19
-
20
-
21
-
22
-
23
-
24
-
25
-
26
-
27
-
28
-
29
-
30
-
31
-
32
-
33
-
34
-
35
-
36
-
37
-
38
-
39
-
40
-
41
-
42
-
43
-
44
-
45
-
46
-
47
-
48
-
49
-
50
-
51
-
52
-
53
-
54
-
55
-
56
-
57
-
58
-
59
-
60
-
 61
61 -
 62
62 -
 63
63 -
 64
64 -
 65
65 -
 66
66 -
 67
67 -
 68
68 -
 69
69 -
 70
70 -
 71
71 -
 72
72 -
 73
73 -
 74
74 -
 75
75 -
 76
76 -
 77
77 -
 78
78 -
 79
79 -
 80
80 -
 81
81 -
82
-
83
-
84
-
85
-
86
-
87
-
88
-
89
-
90
-
91
-
92
-
93
-
94
-
95
-
96
-
97
-
98
-
99
-
100
-
101
-
102
-
103
-
104
-
105
-
106
-
107
-
108
-
109
-
110
-
111
-
112
-
113
-
114
-
115
-
116
-
117
-
118
-
119
-
120
-
121
-
122
-
123
-
124
-
125
-
126
-
127
-
128
-
129
-
130
-
131
-
132
-
133
-
134
-
135
-
136
-
137
-
138
-
139
-
140
-
141
-
142
-
143
-
144
-
145
-
146
-
147
-
148
-
149
-
150
-
151
-
152
-
153
-
154
-
155
-
156
-
157
-
158
-
159
-
160
-
161
-
162
-
163
-
164
-
165
-
166
-
167
-
168
-
169
-
170
-
171
-
172
-
173
-
174
-
175
-
176
-
177
-
178
-
179
-
180
-
181
-
182
-
183
-
184
-
185
-
186
-
187
-
188
-
189
-
190
-
191
-
192
-
193
-
194
-
195
-
196
-
197
-
198
-
199
-
200
-
201
-
202
-
203
-
204
-
205
-
206
-
207
-
208
-
209
-
210
-
211
-
212
-
213
-
214
-
215
-
216
-
217
-
218
-
219
-
220
-
221
-
222
-
223
-
224
-
225
-
226
-
227
-
228
 |
 |

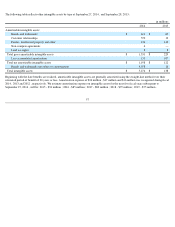
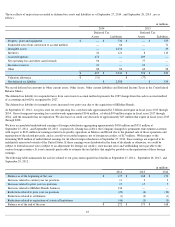
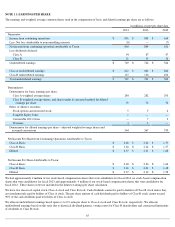
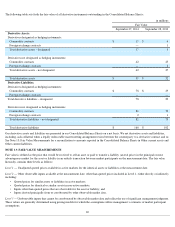
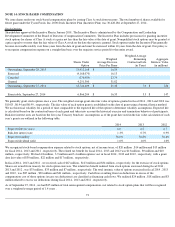
The tax effects of major items recorded as deferred tax assets and liabilities as of September 27, 2014 , and September 28, 2013 , are as
follows:
We record deferred tax amounts in Other current assets, Other Assets, Other current liabilities and Deferred Income Taxes in the Consolidated
Balance Sheets.
The deferred tax liability for suspended taxes from conversion to accrual method represents the 1987 change from the cash to accrual method
of accounting and will be recognized by 2027.
The deferred tax liability for intangible assets increased over prior year due to the acquisition of Hillshire Brands.
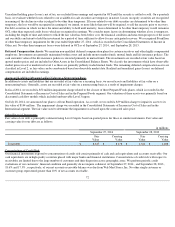
At September 27, 2014 , our gross state tax net operating loss carryforwards approximated $1.3 billion and expire in fiscal years 2015 through
2034 . Gross foreign net operating loss carryforwards approximated $146 million , of which $50 million expire in fiscal years 2017 through
2024 , and the remainder has no expiration. We also have tax credit carryforwards of approximately $25 million that expire in fiscal years
2015
through 2028 .
We have accumulated undistributed earnings of foreign subsidiaries aggregating approximately $403 million and $351 million at
September 27, 2014 , and September 28, 2013 , respectively. During fiscal 2014, the Company changed its permanent reinvestment assertion
with respect to $183 million of earnings related to its poultry operations in Mexico and Brazil due to the planned sale of those operations and
repatriation of the related proceeds, and as a result we recorded expense, net of foreign tax credits, of $17 million . With respect to the
remaining $220 million of undistributed earnings for all other foreign subsidiaries at September 27, 2014, these earnings are expected to be
indefinitely reinvested outside of the United States. If those earnings were distributed in the form of dividends or otherwise, we could be
subject to federal income taxes (subject to an adjustment for foreign tax credits), state income taxes and withholding taxes payable to the
various foreign countries. It is not currently practicable to estimate the tax liability that might be payable on the repatriation of these foreign
earnings.
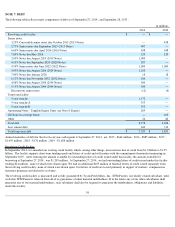
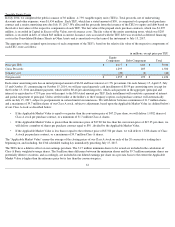
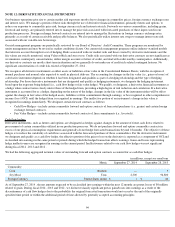
The following table summarizes the activity related to our gross unrecognized tax benefits at September 27, 2014 , September 28, 2013 , and
September 29, 2012 :
63
in millions
2014
2013
Deferred Tax
Deferred Tax
Assets
Liabilities
Assets
Liabilities
Property, plant and equipment
$
—
$
732
$
—
$
525
Suspended taxes from conversion to accrual method
—
66
—
71
Intangible assets
—
2,031
—
29
Inventory
24
121
8
110
Accrued expenses
474
—
209
—
Net operating loss and other carryforwards
96
—
77
—
Insurance reserves
21
—
22
—
Other
80
82
60
98
$
695
$
3,032
$
376
$
833
Valuation allowance
$
(51
)
$
(77
)
Net deferred tax liability
$
2,388
$
534
in millions
2014
2013
2012
Balance as of the beginning of the year
$
175
$
168
$
174
Increases related to current year tax positions
11
3
3
Increases related to prior year tax positions
17
15
5
Increases related to Hillshire Brands balances
136
—
—
Reductions related to prior year tax positions
(20
)
(6
)
(10
)
Reductions related to settlements
(1
)
(2
)
(1
)
Reductions related to expirations of statute of limitations
(46
)
(3
)
(3
)
Balance as of the end of the year
$
272
$
175
$
168