Tyson Foods 2014 Annual Report Download - page 31
Download and view the complete annual report
Please find page 31 of the 2014 Tyson Foods annual report below. You can navigate through the pages in the report by either clicking on the pages listed below, or by using the keyword search tool below to find specific information within the annual report.-
 1
1 -
2
-
3
-
4
-
5
-
6
-
7
-
8
-
9
-
10
-
11
-
12
-
13
-
14
-
15
-
16
-
17
-
18
-
19
-
20
-
 21
21 -
 22
22 -
 23
23 -
 24
24 -
 25
25 -
 26
26 -
 27
27 -
 28
28 -
 29
29 -
 30
30 -
 31
31 -
 32
32 -
 33
33 -
 34
34 -
 35
35 -
 36
36 -
 37
37 -
 38
38 -
 39
39 -
 40
40 -
 41
41 -
42
-
43
-
44
-
45
-
46
-
47
-
48
-
49
-
50
-
51
-
52
-
53
-
54
-
55
-
56
-
57
-
58
-
59
-
60
-
61
-
62
-
63
-
64
-
65
-
66
-
67
-
68
-
69
-
70
-
71
-
72
-
73
-
74
-
75
-
76
-
77
-
78
-
79
-
80
-
81
-
82
-
83
-
84
-
85
-
86
-
87
-
88
-
89
-
90
-
91
-
92
-
93
-
94
-
95
-
96
-
97
-
98
-
99
-
100
-
101
-
102
-
103
-
104
-
105
-
106
-
107
-
108
-
109
-
110
-
111
-
112
-
113
-
114
-
115
-
116
-
117
-
118
-
119
-
120
-
121
-
122
-
123
-
124
-
125
-
126
-
127
-
128
-
129
-
130
-
131
-
132
-
133
-
134
-
135
-
136
-
137
-
138
-
139
-
140
-
141
-
142
-
143
-
144
-
145
-
146
-
147
-
148
-
149
-
150
-
151
-
152
-
153
-
154
-
155
-
156
-
157
-
158
-
159
-
160
-
161
-
162
-
163
-
164
-
165
-
166
-
167
-
168
-
169
-
170
-
171
-
172
-
173
-
174
-
175
-
176
-
177
-
178
-
179
-
180
-
181
-
182
-
183
-
184
-
185
-
186
-
187
-
188
-
189
-
190
-
191
-
192
-
193
-
194
-
195
-
196
-
197
-
198
-
199
-
200
-
201
-
202
-
203
-
204
-
205
-
206
-
207
-
208
-
209
-
210
-
211
-
212
-
213
-
214
-
215
-
216
-
217
-
218
-
219
-
220
-
221
-
222
-
223
-
224
-
225
-
226
-
227
-
228
 |
 |

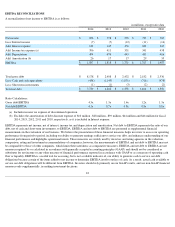
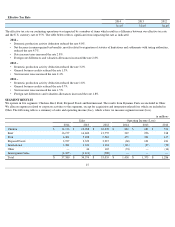
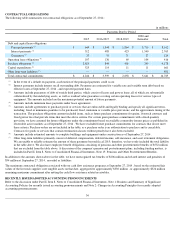
The effective tax rate on continuing operations was impacted by a number of items which result in a difference between our effective tax rate
and the U.S. statutory rate of 35%. The table below reflects significant items impacting the rate as indicated.
2014 –
2013 –
2012 –
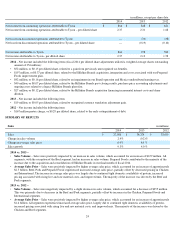
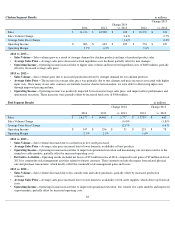
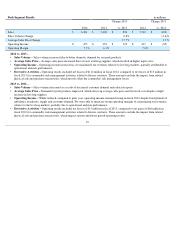
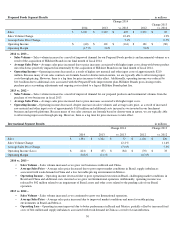
SEGMENT RESULTS
We operate in five segments: Chicken, Beef, Pork, Prepared Foods and International. The results from Dynamic Fuels are included in Other.
We allocate expenses related to corporate activities to the segments, except for acquisition and integration related fees which are included in
Other. The following table is a summary of sales and operating income (loss), which is how we measure segment income (loss).
27
Effective Tax Rate
2014
2013
2012
31.6
%
32.6
%
36.4
%
•
Domestic production activity deduction reduced the rate 4.0%.
•
Net decrease in unrecognized tax benefits, mostly related to expiration of statutes of limitations and settlements with taxing authorities,
reduced the rate 4.7%.
•
State income taxes increased the rate 2.8%.
•
Foreign rate differences and valuation allowances increased the rate 2.8%.
•
Domestic production activity deduction reduced the rate 3.2%.
•
General business credits reduced the rate 1.3%.
•
State income taxes increased the rate 2.4%.
•
Domestic production activity deduction reduced the rate 1.8%.
•
General business credits reduced the rate 0.7%.
•
State income taxes increased the rate 1.5%.
•
Foreign rate differences and valuation allowances increased the rate 1.8%.
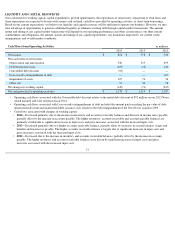
in millions
Sales
Operating Income (Loss)
2014
2013
2012
2014
2013
2012
Chicken
$
11,116
$
10,988
$
10,270
$
883
$
683
$
554
Beef
16,177
14,400
13,755
347
296
218
Pork
6,304
5,408
5,510
455
332
417
Prepared Foods
3,927
3,322
3,237
(60
)
101
181
International
1,381
1,324
1,104
(121
)
(37
)
(70
)
Other
—
46
167
(74
)
—
(
14
)
Intersegment Sales
(1,325
)
(1,114
)
(988
)
—
—
—
Total
$
37,580
$
34,374
$
33,055
$
1,430
$
1,375
$
1,286