Tyson Foods 2014 Annual Report Download - page 82
Download and view the complete annual report
Please find page 82 of the 2014 Tyson Foods annual report below. You can navigate through the pages in the report by either clicking on the pages listed below, or by using the keyword search tool below to find specific information within the annual report.-
 1
1 -
2
-
3
-
4
-
5
-
6
-
7
-
8
-
9
-
10
-
11
-
12
-
13
-
14
-
15
-
16
-
17
-
18
-
19
-
20
-
21
-
22
-
23
-
24
-
25
-
26
-
27
-
28
-
29
-
30
-
31
-
32
-
33
-
34
-
35
-
36
-
37
-
38
-
39
-
40
-
41
-
42
-
43
-
44
-
45
-
46
-
47
-
48
-
49
-
50
-
51
-
52
-
53
-
54
-
55
-
56
-
57
-
58
-
59
-
60
-
61
-
62
-
63
-
64
-
65
-
66
-
67
-
68
-
69
-
70
-
71
-
 72
72 -
 73
73 -
 74
74 -
 75
75 -
 76
76 -
 77
77 -
 78
78 -
 79
79 -
 80
80 -
 81
81 -
 82
82 -
 83
83 -
 84
84 -
 85
85 -
 86
86 -
 87
87 -
 88
88 -
 89
89 -
 90
90 -
 91
91 -
 92
92 -
93
-
94
-
95
-
96
-
97
-
98
-
99
-
100
-
101
-
102
-
103
-
104
-
105
-
106
-
107
-
108
-
109
-
110
-
111
-
112
-
113
-
114
-
115
-
116
-
117
-
118
-
119
-
120
-
121
-
122
-
123
-
124
-
125
-
126
-
127
-
128
-
129
-
130
-
131
-
132
-
133
-
134
-
135
-
136
-
137
-
138
-
139
-
140
-
141
-
142
-
143
-
144
-
145
-
146
-
147
-
148
-
149
-
150
-
151
-
152
-
153
-
154
-
155
-
156
-
157
-
158
-
159
-
160
-
161
-
162
-
163
-
164
-
165
-
166
-
167
-
168
-
169
-
170
-
171
-
172
-
173
-
174
-
175
-
176
-
177
-
178
-
179
-
180
-
181
-
182
-
183
-
184
-
185
-
186
-
187
-
188
-
189
-
190
-
191
-
192
-
193
-
194
-
195
-
196
-
197
-
198
-
199
-
200
-
201
-
202
-
203
-
204
-
205
-
206
-
207
-
208
-
209
-
210
-
211
-
212
-
213
-
214
-
215
-
216
-
217
-
218
-
219
-
220
-
221
-
222
-
223
-
224
-
225
-
226
-
227
-
228
 |
 |

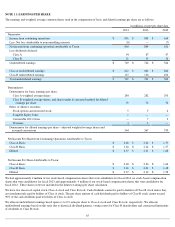
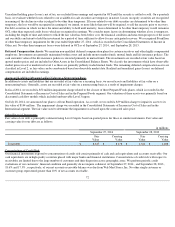
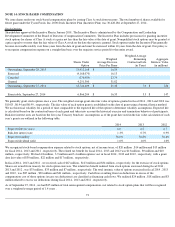
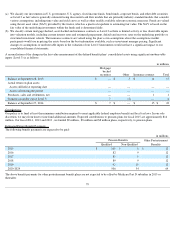
Restricted Stock
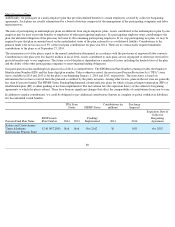
We issue restricted stock at the market value as of the date of grant, with restrictions expiring over periods through fiscal 2017. Unearned
compensation is recognized over the vesting period for the particular grant using a straight-line method.
As of September 27, 2014 , we had $10 million of total unrecognized compensation cost related to restricted stock awards that will be
recognized over a weighted average period of 1.2 years .
We recognized stock-based compensation expense related to restricted stock, net of income taxes, of $6 million , $5 million and $7 million for
fiscal 2014 , 2013 and 2012 , respectively. The related tax benefit for fiscal 2014 , 2013 and 2012 was $4 million , $3 million and $4 million ,
respectively. We had 0.6 million , 1.4 million and 1.2 million restricted stock awards vest in fiscal 2014 , 2013 and 2012 , respectively, with a
grant date fair value of $11 million , $20 million and $17 million , respectively.
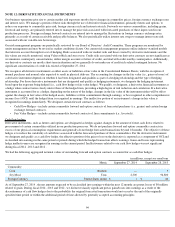
Performance-Based Shares
We award performance-based shares of our Class A stock to certain senior executives. These awards are typically granted once a year.
Performance-based shares vest based upon the passage of time and the achievement of performance or market performance criteria, ranging
from 0% to 200% , as determined by the Compensation Committee prior to the date of the award. Vesting periods for these awards are
generally three years . We review progress toward the attainment of the performance criteria each quarter during the vesting period. When it is
probable the minimum performance criteria for an award will be achieved, we begin recognizing the expense equal to the proportionate share
of the total fair value of the Class A stock price on the grant date. The total expense recognized over the duration of performance awards will
equal the Class A stock price on the date of grant multiplied by the number of shares ultimately awarded based on the level of attainment of the
performance criteria. For grants with market performance criteria, the total expense recognized over the duration of the award will equal the
fair value as determined on the grant date, regardless if the market performance criteria is met.
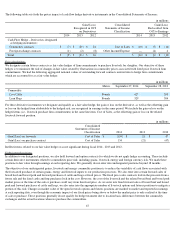
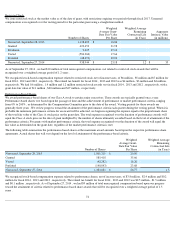
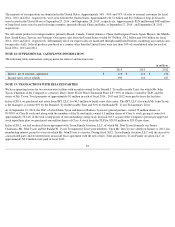
The following table summarizes the performance-based shares at the maximum award amounts based upon the respective performance share
agreements. Actual shares that will vest depend on the level of attainment of the performance-based criteria.
We recognized stock-based compensation expense related to performance shares, net of income taxes, of $3.8 million , $2.4 million and $0.2
million for fiscal 2014 , 2013 and 2012 , respectively. The related tax benefit for fiscal 2014 , 2013 and 2012 was $2.5 million , $1.5 million
and $0.1 million , respectively. As of September 27, 2014 , we had $9 million of total unrecognized compensation based upon our progress
toward the attainment of criteria related to performance-based share awards that will be recognized over a weighted average period of 1.5
years
.
74
Number of Shares
Weighted
Average Grant-
Date Fair Value
Per Share
Weighted Average
Remaining
Contractual Life
(in Years)
Aggregate
Intrinsic Value
(in millions)
Nonvested, September 28, 2013
1,138,699
$
16.86
Granted
423,453
31.98
Dividends
9,225
37.14
Vested
(584,360
)
17.66
Forfeited
(48,073
)
20.83
Nonvested, September 27, 2014
938,944
$
23.18
1.2
$
35
Number of Shares
Weighted
Average Grant-
Date Fair Value
Per Share
Weighted Average
Remaining
Contractual Life
(in Years)
Nonvested, September 28, 2013
1,001,310
$
20.99
Granted
585,418
35.66
Vested
(42,282
)
16.26
Forfeited
(140,843
)
23.68
Nonvested, September 27, 2014
1,403,603
$
26.77
1.5