Tyson Foods 2014 Annual Report Download - page 59
Download and view the complete annual report
Please find page 59 of the 2014 Tyson Foods annual report below. You can navigate through the pages in the report by either clicking on the pages listed below, or by using the keyword search tool below to find specific information within the annual report.-
 1
1 -
2
-
3
-
4
-
5
-
6
-
7
-
8
-
9
-
10
-
11
-
12
-
13
-
14
-
15
-
16
-
17
-
18
-
19
-
20
-
21
-
22
-
23
-
24
-
25
-
26
-
27
-
28
-
29
-
30
-
31
-
32
-
33
-
34
-
35
-
36
-
37
-
38
-
39
-
40
-
41
-
42
-
43
-
44
-
45
-
46
-
47
-
48
-
 49
49 -
 50
50 -
 51
51 -
 52
52 -
 53
53 -
 54
54 -
 55
55 -
 56
56 -
 57
57 -
 58
58 -
 59
59 -
 60
60 -
 61
61 -
 62
62 -
 63
63 -
 64
64 -
 65
65 -
 66
66 -
 67
67 -
 68
68 -
 69
69 -
70
-
71
-
72
-
73
-
74
-
75
-
76
-
77
-
78
-
79
-
80
-
81
-
82
-
83
-
84
-
85
-
86
-
87
-
88
-
89
-
90
-
91
-
92
-
93
-
94
-
95
-
96
-
97
-
98
-
99
-
100
-
101
-
102
-
103
-
104
-
105
-
106
-
107
-
108
-
109
-
110
-
111
-
112
-
113
-
114
-
115
-
116
-
117
-
118
-
119
-
120
-
121
-
122
-
123
-
124
-
125
-
126
-
127
-
128
-
129
-
130
-
131
-
132
-
133
-
134
-
135
-
136
-
137
-
138
-
139
-
140
-
141
-
142
-
143
-
144
-
145
-
146
-
147
-
148
-
149
-
150
-
151
-
152
-
153
-
154
-
155
-
156
-
157
-
158
-
159
-
160
-
161
-
162
-
163
-
164
-
165
-
166
-
167
-
168
-
169
-
170
-
171
-
172
-
173
-
174
-
175
-
176
-
177
-
178
-
179
-
180
-
181
-
182
-
183
-
184
-
185
-
186
-
187
-
188
-
189
-
190
-
191
-
192
-
193
-
194
-
195
-
196
-
197
-
198
-
199
-
200
-
201
-
202
-
203
-
204
-
205
-
206
-
207
-
208
-
209
-
210
-
211
-
212
-
213
-
214
-
215
-
216
-
217
-
218
-
219
-
220
-
221
-
222
-
223
-
224
-
225
-
226
-
227
-
228
 |
 |

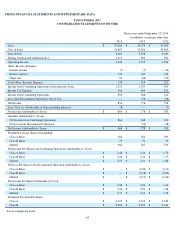
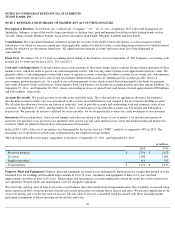
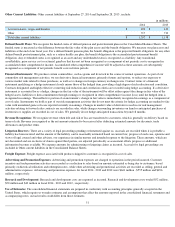
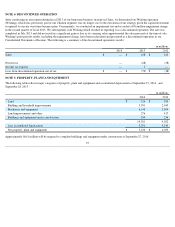
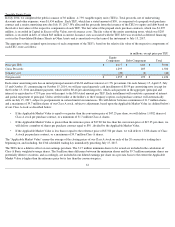
Other Current Liabilities: Other current liabilities at September 27, 2014 and September 28, 2013 , include:
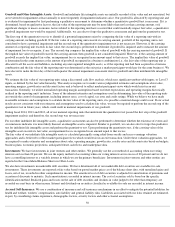
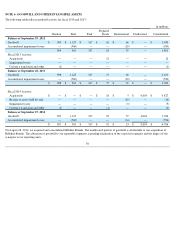
Defined Benefit Plans: We recognize the funded status of defined pension and postretirement plans in the Consolidated Balance Sheets. The
funded status is measured as the difference between the fair value of the plan assets and the benefit obligation. We measure our plan assets and
liabilities at the end of our fiscal year. For a defined benefit pension plan, the benefit obligation is the projected benefit obligation; for any other
defined benefit postretirement plan, such as a retiree health care plan, the benefit obligation is the accumulated postretirement benefit
obligation. Any overfunded status is recognized as an asset and any underfunded status is recognized as a liability. Any transitional
asset/liability, prior service cost or actuarial gain/loss that has not yet been recognized as a component of net periodic cost is recognized in
accumulated other comprehensive income. Accumulated other comprehensive income will be adjusted as these amounts are subsequently
recognized as a component of net periodic benefit costs in future periods.
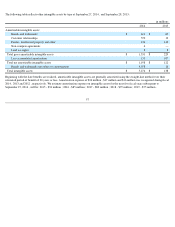
Financial Instruments: We purchase certain commodities, such as grains and livestock in the course of normal operations. As part of our
commodity risk management activities, we use derivative financial instruments, primarily futures and options, to reduce our exposure to
various market risks related to these purchases, as well as to changes in foreign currency exchange rates. Contract terms of a financial
instrument qualifying as a hedge instrument closely mirror those of the hedged item, providing a high degree of risk reduction and correlation.
Contracts designated and highly effective at meeting risk reduction and correlation criteria are recorded using hedge accounting. If a derivative
instrument is accounted for as a hedge, changes in the fair value of the instrument will be offset either against the change in fair value of the
hedged assets, liabilities or firm commitments through earnings or recognized in other comprehensive income (loss) until the hedged item is
recognized in earnings. The ineffective portion of an instrument’
s change in fair value is immediately recognized in earnings as a component of
cost of sales. Instruments we hold as part of our risk management activities that do not meet the criteria for hedge accounting are marked to fair
value with unrealized gains or losses reported currently in earnings. Changes in market value of derivatives used in our risk management
activities relating to forward sales contracts are recorded in sales, while changes surrounding inventories on hand or anticipated purchases of
inventories or supplies are recorded in cost of sales. We generally do not hedge anticipated transactions beyond 18 months.
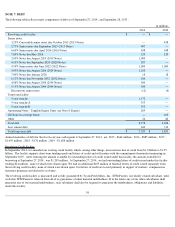
Revenue Recognition: We recognize revenue when title and risk of loss are transferred to customers, which is generally on delivery based on
terms of sale. Revenue is recognized as the net amount estimated to be received after deducting estimated amounts for discounts, trade
allowances and product terms.
Litigation Reserves: There are a variety of legal proceedings pending or threatened against us. Accruals are recorded when it is probable a
liability has been incurred and the amount of the liability can be reasonably estimated based on current law, progress of each case, opinions and
views of legal counsel and other advisers, our experience in similar matters and intended response to the litigation. These amounts, which are
not discounted and are exclusive of claims against third parties, are adjusted periodically as assessment efforts progress or additional
information becomes available. We expense amounts for administering or litigating claims as incurred. Accruals for legal proceedings are
included in Other current liabilities in the Consolidated Balance Sheets.
Freight Expense: Freight expense associated with products shipped to customers is recognized in cost of sales.
Advertising and Promotion Expenses: Advertising and promotion expenses are charged to operations in the period incurred. Customer
incentive and trade promotion activities are recorded as a reduction to sales based on amounts estimated as being due to customers, based
primarily on historical utilization and redemption rates, while other advertising and promotional activities are recorded as selling, general and
administrative expenses. Advertising and promotion expenses for fiscal 2014 , 2013 and 2012 were $641 million , $555 million and $496
million , respectively.
Research and Development: Research and development costs are expensed as incurred. Research and development costs totaled $52 million ,
$50 million and $43 million in fiscal 2014 , 2013 and 2012 , respectively.
Use of Estimates: The consolidated financial statements are prepared in conformity with accounting principles generally accepted in the
United States, which require us to make estimates and assumptions that affect the amounts reported in the consolidated financial statements and
accompanying notes. Actual results could differ from those estimates.
51
in millions
2014
2013
Accrued salaries, wages and benefits
$
490
$
419
Other
717
719
Total other current liabilities
$
1,207
$
1,138