Tyson Foods 2014 Annual Report Download - page 87
Download and view the complete annual report
Please find page 87 of the 2014 Tyson Foods annual report below. You can navigate through the pages in the report by either clicking on the pages listed below, or by using the keyword search tool below to find specific information within the annual report.-
 1
1 -
2
-
3
-
4
-
5
-
6
-
7
-
8
-
9
-
10
-
11
-
12
-
13
-
14
-
15
-
16
-
17
-
18
-
19
-
20
-
21
-
22
-
23
-
24
-
25
-
26
-
27
-
28
-
29
-
30
-
31
-
32
-
33
-
34
-
35
-
36
-
37
-
38
-
39
-
40
-
41
-
42
-
43
-
44
-
45
-
46
-
47
-
48
-
49
-
50
-
51
-
52
-
53
-
54
-
55
-
56
-
57
-
58
-
59
-
60
-
61
-
62
-
63
-
64
-
65
-
66
-
67
-
68
-
69
-
70
-
71
-
72
-
73
-
74
-
75
-
76
-
 77
77 -
 78
78 -
 79
79 -
 80
80 -
 81
81 -
 82
82 -
 83
83 -
 84
84 -
 85
85 -
 86
86 -
 87
87 -
 88
88 -
 89
89 -
 90
90 -
 91
91 -
 92
92 -
 93
93 -
 94
94 -
 95
95 -
 96
96 -
 97
97 -
98
-
99
-
100
-
101
-
102
-
103
-
104
-
105
-
106
-
107
-
108
-
109
-
110
-
111
-
112
-
113
-
114
-
115
-
116
-
117
-
118
-
119
-
120
-
121
-
122
-
123
-
124
-
125
-
126
-
127
-
128
-
129
-
130
-
131
-
132
-
133
-
134
-
135
-
136
-
137
-
138
-
139
-
140
-
141
-
142
-
143
-
144
-
145
-
146
-
147
-
148
-
149
-
150
-
151
-
152
-
153
-
154
-
155
-
156
-
157
-
158
-
159
-
160
-
161
-
162
-
163
-
164
-
165
-
166
-
167
-
168
-
169
-
170
-
171
-
172
-
173
-
174
-
175
-
176
-
177
-
178
-
179
-
180
-
181
-
182
-
183
-
184
-
185
-
186
-
187
-
188
-
189
-
190
-
191
-
192
-
193
-
194
-
195
-
196
-
197
-
198
-
199
-
200
-
201
-
202
-
203
-
204
-
205
-
206
-
207
-
208
-
209
-
210
-
211
-
212
-
213
-
214
-
215
-
216
-
217
-
218
-
219
-
220
-
221
-
222
-
223
-
224
-
225
-
226
-
227
-
228
 |
 |
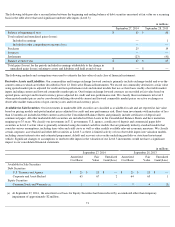
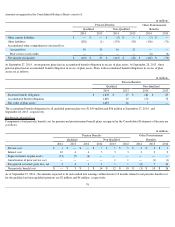
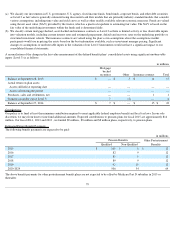
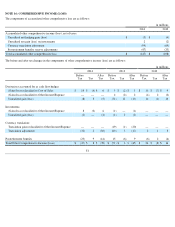
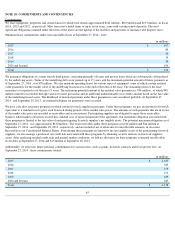
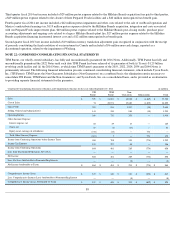
A reconciliation of the change in the fair value measurement of the defined benefit plans’ consolidated assets using significant unobservable
inputs (Level 3) is as follows:
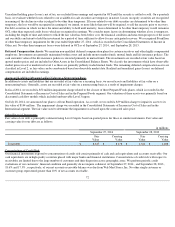
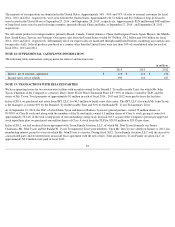
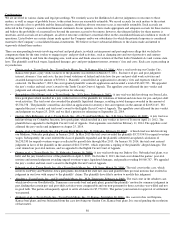
Contributions
Our policy is to fund at least the minimum contribution required to meet applicable federal employee benefit and local tax laws. In our sole
discretion, we may from time to time fund additional amounts. Expected contributions to pension plans for fiscal 2015 are approximately $14
million . For fiscal 2014 , 2013 and 2012 , we funded $9 million , $8 million and $8 million plans, respectively, to pension plans.
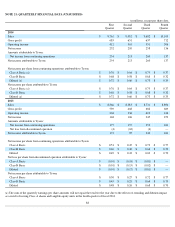
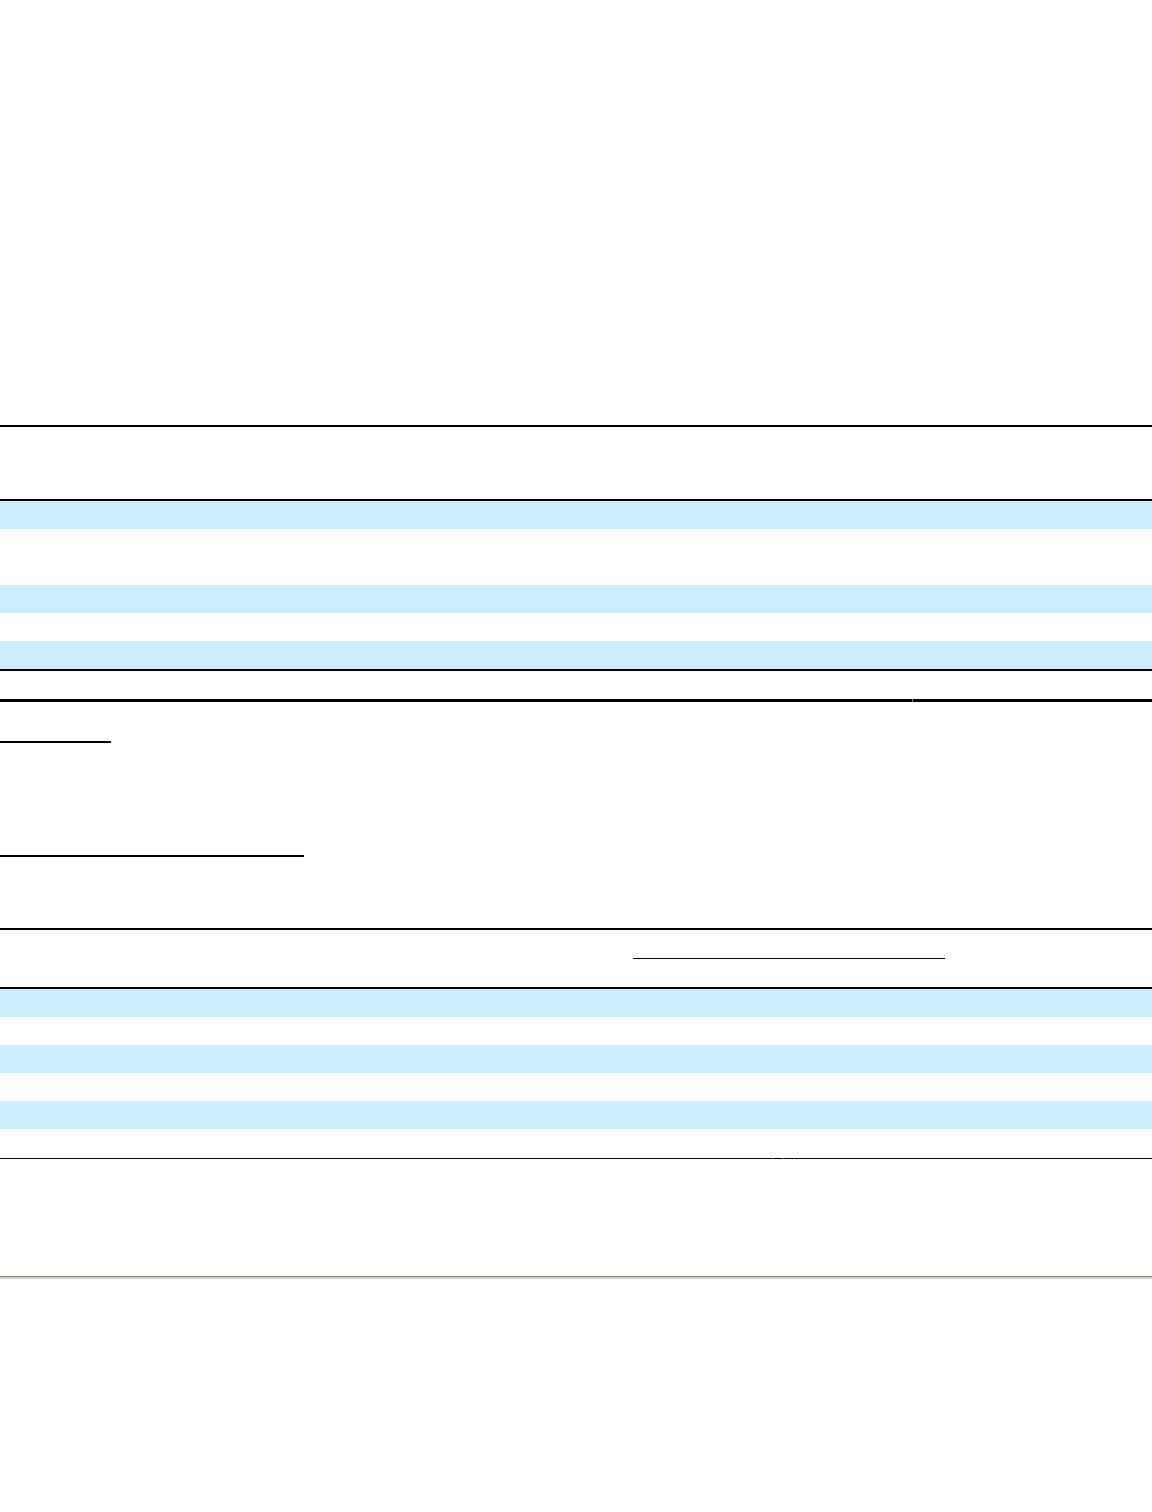
Estimated Future Benefit Payments
The following benefit payments are expected to be paid:
The above benefit payments for other postretirement benefit plans are not expected to be offset by Medicare Part D subsidies in 2015 or
thereafter.
79
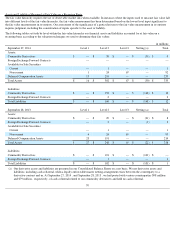
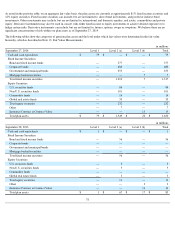
(a) We classify our investments in U.S. government, U.S. agency, fixed income funds, bond funds, corporate bonds, and other debt securities
as Level 2 as fair value is generally estimated using discounted cash flow models that are primarily industry-standard models that consider
various assumptions, including time value and yield curve as well as other readily available relevant economic measures. Funds are valued
using the net asset value (NAV) provided by the trustee, which is a practical expedient to estimating fair value. The NAV is based on the
fair value of the underlying investments within the funds and is determined daily.
(b) We classify certain mortgage-backed, asset-backed and insurance contracts as Level 3 as there is limited activity or less observable inputs
into valuation models, including current interest rates and estimated prepayment, default and recovery rates on the underlying portfolio or
structured investment vehicle. The insurance contracts are valued using the plan’s own assumptions about the assumptions market
participants would use in pricing the assets based on the best information available, such as investment manager pricing. Significant
changes to assumptions or unobservable inputs in the valuation of our Level 3 instruments would not have a significant impact to our
consolidated financial statements.
in millions
Mortgage
backed
securities
Other
Insurance contract
Total
Balance at September 28, 2013
$
—
$
3
$
14
17
Actual return on plan assets:
Assets still held at reporting date
—
—
—
—
Assets sold during the period
—
—
—
—
Purchases, sales and settlements, net
—
—
1
1
Transfers in and/or out of Level 3
7
(3
)
—
4
Balance at September 27, 2014
$
7
$
—
$
15
$
22
in millions
Pension Benefits
Other Postretirement
Qualified
Non-Qualified
Benefits
2015
$
108
$
8
$
12
2016
82
9
12
2017
85
9
12
2018
89
9
12
2019
92
10
12
2020-2024
506
54
64