Tyson Foods 2014 Annual Report Download - page 48
Download and view the complete annual report
Please find page 48 of the 2014 Tyson Foods annual report below. You can navigate through the pages in the report by either clicking on the pages listed below, or by using the keyword search tool below to find specific information within the annual report.-
 1
1 -
2
-
3
-
4
-
5
-
6
-
7
-
8
-
9
-
10
-
11
-
12
-
13
-
14
-
15
-
16
-
17
-
18
-
19
-
20
-
21
-
22
-
23
-
24
-
25
-
26
-
27
-
28
-
29
-
30
-
31
-
32
-
33
-
34
-
35
-
36
-
37
-
 38
38 -
 39
39 -
 40
40 -
 41
41 -
 42
42 -
 43
43 -
 44
44 -
 45
45 -
 46
46 -
 47
47 -
 48
48 -
 49
49 -
 50
50 -
 51
51 -
 52
52 -
 53
53 -
 54
54 -
 55
55 -
 56
56 -
 57
57 -
 58
58 -
59
-
60
-
61
-
62
-
63
-
64
-
65
-
66
-
67
-
68
-
69
-
70
-
71
-
72
-
73
-
74
-
75
-
76
-
77
-
78
-
79
-
80
-
81
-
82
-
83
-
84
-
85
-
86
-
87
-
88
-
89
-
90
-
91
-
92
-
93
-
94
-
95
-
96
-
97
-
98
-
99
-
100
-
101
-
102
-
103
-
104
-
105
-
106
-
107
-
108
-
109
-
110
-
111
-
112
-
113
-
114
-
115
-
116
-
117
-
118
-
119
-
120
-
121
-
122
-
123
-
124
-
125
-
126
-
127
-
128
-
129
-
130
-
131
-
132
-
133
-
134
-
135
-
136
-
137
-
138
-
139
-
140
-
141
-
142
-
143
-
144
-
145
-
146
-
147
-
148
-
149
-
150
-
151
-
152
-
153
-
154
-
155
-
156
-
157
-
158
-
159
-
160
-
161
-
162
-
163
-
164
-
165
-
166
-
167
-
168
-
169
-
170
-
171
-
172
-
173
-
174
-
175
-
176
-
177
-
178
-
179
-
180
-
181
-
182
-
183
-
184
-
185
-
186
-
187
-
188
-
189
-
190
-
191
-
192
-
193
-
194
-
195
-
196
-
197
-
198
-
199
-
200
-
201
-
202
-
203
-
204
-
205
-
206
-
207
-
208
-
209
-
210
-
211
-
212
-
213
-
214
-
215
-
216
-
217
-
218
-
219
-
220
-
221
-
222
-
223
-
224
-
225
-
226
-
227
-
228
 |
 |

All of our material reporting units' estimated fair value exceeded their carrying value by more than 20% at the date of their most recent
estimated fair value determination. Consequently, we do not currently consider any of our material reporting units at significant risk of failing
the first step of the annual goodwill impairment test. At September 27, 2014, $4.8 billion of goodwill associated with our acquisition of
Hillshire Brands has not yet been allocated to our reporting units. The allocation of this goodwill to our reporting units is pending finalization
of the expected synergies and the impact of the synergies to our reporting units.
Our fiscal 2014 other indefinite life intangible asset impairment analysis did not result in an impairment charge. A hypothetical 20% decrease
in the fair value of non-Hillshire Brands intangible assets would not result in a material impairment. We recorded $4.1 billion of indefinite life
intangibles (brands and trademarks) associated with our acquisition of Hillshire Brands. Any significant decline in the estimated fair value of
the Hillshire Brands indefinite life intangibles could result in a material impairment.
ITEM 7A. QUANTITATIVE AND QUALITATIVE DISCLOSURES ABOUT MARKET RISK
Market risk relating to our operations results primarily from changes in commodity prices, interest rates and foreign exchange rates, as well as
credit risk concentrations. To address certain of these risks, we enter into various derivative transactions as described below. If a derivative
instrument is accounted for as a hedge, depending on the nature of the hedge, changes in the fair value of the instrument either will be offset
against the change in fair value of the hedged assets, liabilities or firm commitments through earnings, or be recognized in other comprehensive
income (loss) until the hedged item is recognized in earnings. The ineffective portion of an instrument’s change in fair value is recognized
immediately. Additionally, we hold certain positions, primarily in grain and livestock futures that either do not meet the criteria for hedge
accounting or are not designated as hedges. With the exception of normal purchases and normal sales that are expected to result in physical
delivery, we record these positions at fair value, and the unrealized gains and losses are reported in earnings at each reporting date. Changes in
market value of derivatives used in our risk management activities relating to forward sales contracts are recorded in sales. Changes in market
value of derivatives used in our risk management activities surrounding inventories on hand or anticipated purchases of inventories are
recorded in cost of sales.
The sensitivity analyses presented below are the measures of potential losses of fair value resulting from hypothetical changes in market prices
related to commodities. Sensitivity analyses do not consider the actions we may take to mitigate our exposure to changes, nor do they consider
the effects such hypothetical adverse changes may have on overall economic activity. Actual changes in market prices may differ from
hypothetical changes.
Commodities Risk: We purchase certain commodities, such as grains and livestock in the course of normal operations. As part of our
commodity risk management activities, we use derivative financial instruments, primarily futures and options, to reduce the effect of changing
prices and as a mechanism to procure the underlying commodity. However, as the commodities underlying our derivative financial instruments
can experience significant price fluctuations, any requirement to mark-to-market the positions that have not been designated or do not qualify
as hedges could result in volatility in our results of operations. Contract terms of a hedge instrument closely mirror those of the hedged item
providing a high degree of risk reduction and correlation. Contracts designated and highly effective at meeting this risk reduction and
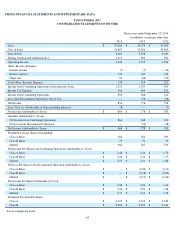
correlation criteria are recorded using hedge accounting. The following table presents a sensitivity analysis resulting from a hypothetical
change of 10% in market prices as of September 27, 2014 , and September 28, 2013 , on the fair value of open positions. The fair value of such
positions is a summation of the fair values calculated for each commodity by valuing each net position at quoted futures prices. The market risk
exposure analysis includes hedge and non-hedge derivative financial instruments.
Interest Rate Risk: At September 27, 2014 , we had variable rate debt of $2.1 billion with a weighted average interest rate of 1.6%. A
hypothetical 10% increase in interest rates effective at September 27, 2014 , and September 28, 2013 , would have a minimal effect on interest
expense.
Additionally, changes in interest rates impact the fair value of our fixed-rate debt. At September 27, 2014 , we had fixed-rate debt of $6.1
billion with a weighted average interest rate of 4.3%. Market risk for fixed-
rate debt is estimated as the potential increase in fair value, resulting
from a hypothetical 10% decrease in interest rates. A hypothetical 10% decrease in interest rates would have increased the fair value of our
fixed-rate debt by approximately $109 million at September 27, 2014 , and $22 million at September 28, 2013 . The fair values of our debt
were estimated based on quoted market prices and/or published interest rates.
42
Effect of 10% change in fair value
in millions
2014
2013
Livestock:
Cattle
$
42
$
13
Hogs
32
35
Grain
10
23