Tyson Foods 2014 Annual Report Download - page 83
Download and view the complete annual report
Please find page 83 of the 2014 Tyson Foods annual report below. You can navigate through the pages in the report by either clicking on the pages listed below, or by using the keyword search tool below to find specific information within the annual report.-
 1
1 -
2
-
3
-
4
-
5
-
6
-
7
-
8
-
9
-
10
-
11
-
12
-
13
-
14
-
15
-
16
-
17
-
18
-
19
-
20
-
21
-
22
-
23
-
24
-
25
-
26
-
27
-
28
-
29
-
30
-
31
-
32
-
33
-
34
-
35
-
36
-
37
-
38
-
39
-
40
-
41
-
42
-
43
-
44
-
45
-
46
-
47
-
48
-
49
-
50
-
51
-
52
-
53
-
54
-
55
-
56
-
57
-
58
-
59
-
60
-
61
-
62
-
63
-
64
-
65
-
66
-
67
-
68
-
69
-
70
-
71
-
72
-
 73
73 -
 74
74 -
 75
75 -
 76
76 -
 77
77 -
 78
78 -
 79
79 -
 80
80 -
 81
81 -
 82
82 -
 83
83 -
 84
84 -
 85
85 -
 86
86 -
 87
87 -
 88
88 -
 89
89 -
 90
90 -
 91
91 -
 92
92 -
 93
93 -
94
-
95
-
96
-
97
-
98
-
99
-
100
-
101
-
102
-
103
-
104
-
105
-
106
-
107
-
108
-
109
-
110
-
111
-
112
-
113
-
114
-
115
-
116
-
117
-
118
-
119
-
120
-
121
-
122
-
123
-
124
-
125
-
126
-
127
-
128
-
129
-
130
-
131
-
132
-
133
-
134
-
135
-
136
-
137
-
138
-
139
-
140
-
141
-
142
-
143
-
144
-
145
-
146
-
147
-
148
-
149
-
150
-
151
-
152
-
153
-
154
-
155
-
156
-
157
-
158
-
159
-
160
-
161
-
162
-
163
-
164
-
165
-
166
-
167
-
168
-
169
-
170
-
171
-
172
-
173
-
174
-
175
-
176
-
177
-
178
-
179
-
180
-
181
-
182
-
183
-
184
-
185
-
186
-
187
-
188
-
189
-
190
-
191
-
192
-
193
-
194
-
195
-
196
-
197
-
198
-
199
-
200
-
201
-
202
-
203
-
204
-
205
-
206
-
207
-
208
-
209
-
210
-
211
-
212
-
213
-
214
-
215
-
216
-
217
-
218
-
219
-
220
-
221
-
222
-
223
-
224
-
225
-
226
-
227
-
228
 |
 |

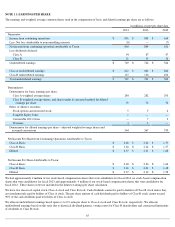
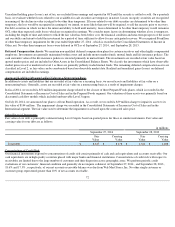
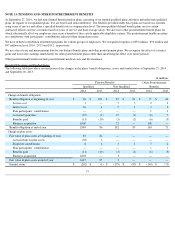
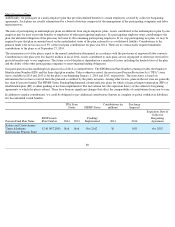
NOTE 15: PENSIONS AND OTHER POSTRETIREMENT BENEFITS
At September 27, 2014 , we had nine defined benefit pension plans consisting of six funded qualified plans and three unfunded non-qualified
plans. In regards to our qualified plans, five are frozen and noncontributory. The benefits provided under these plans are based on a formula
using years of service and either a specified benefit rate or compensation level. The non-qualified defined benefit plans are for certain
contracted officers and use a formula based on years of service and final average salary. We also have other postretirement benefit plans for
which substantially all of our employees may receive benefits if they satisfy applicable eligibility criteria. The postretirement healthcare plans
are contributory with participants’ contributions adjusted when deemed necessary.
We have defined contribution retirement programs for various groups of employees. We recognized expenses of $53 million , $50 million and
$47 million in fiscal 2014 , 2013 and 2012 , respectively.
We use a fiscal year end measurement date for our defined benefit plans and other postretirement plans. We recognize the effect of actuarial
gains and losses into earnings immediately for other postretirement plans rather than amortizing the effect over future periods.
Other postretirement benefits include postretirement medical costs and life insurance.
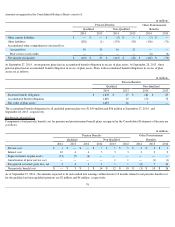
Benefit Obligations and Funded Status
The following table provides a reconciliation of the changes in the plans’ benefit obligations, assets and funded status at September 27, 2014 ,
and September 28, 2013 :
75
in millions
Pension Benefits
Other Postretirement
Qualified
Non-Qualified
Benefits
2014
2013
2014
2013
2014
2013
Change in benefit obligation
Benefit obligation at beginning of year
$
86
$
101
$
85
$
81
$
71
$
64
Service cost
1
—
7
5
2
2
Interest cost
10
4
5
3
3
2
Plan participants’ contributions
—
—
—
—
1
1
Actuarial (gain)/loss
(37
)
(9
)
15
(2
)
(8
)
7
Benefits paid
(11
)
(10
)
(3
)
(2
)
(6
)
(5
)
Business acquisition
1,800
—
73
—
100
—
Benefit obligation at end of year
1,849
86
182
85
163
71
Change in plan assets
Fair value of plan assets at beginning of year
85
86
—
—
—
—
Actual return on plan assets
(36
)
3
—
—
—
—
Employer contributions
6
6
3
2
5
4
Plan participants’ contributions
—
—
—
—
1
1
Benefits paid
(11
)
(10
)
(3
)
(2
)
(6
)
(5
)
Business acquisition
1,603
—
3
—
—
—
Fair value of plan assets at end of year
1,647
85
3
—
—
—
Funded status
$
(202
)
$
(1
)
$
(179
)
$
(85
)
$
(163
)
$
(71
)