Tyson Foods 2014 Annual Report Download - page 69
Download and view the complete annual report
Please find page 69 of the 2014 Tyson Foods annual report below. You can navigate through the pages in the report by either clicking on the pages listed below, or by using the keyword search tool below to find specific information within the annual report.-
 1
1 -
2
-
3
-
4
-
5
-
6
-
7
-
8
-
9
-
10
-
11
-
12
-
13
-
14
-
15
-
16
-
17
-
18
-
19
-
20
-
21
-
22
-
23
-
24
-
25
-
26
-
27
-
28
-
29
-
30
-
31
-
32
-
33
-
34
-
35
-
36
-
37
-
38
-
39
-
40
-
41
-
42
-
43
-
44
-
45
-
46
-
47
-
48
-
49
-
50
-
51
-
52
-
53
-
54
-
55
-
56
-
57
-
58
-
 59
59 -
 60
60 -
 61
61 -
 62
62 -
 63
63 -
 64
64 -
 65
65 -
 66
66 -
 67
67 -
 68
68 -
 69
69 -
 70
70 -
 71
71 -
 72
72 -
 73
73 -
 74
74 -
 75
75 -
 76
76 -
 77
77 -
 78
78 -
 79
79 -
80
-
81
-
82
-
83
-
84
-
85
-
86
-
87
-
88
-
89
-
90
-
91
-
92
-
93
-
94
-
95
-
96
-
97
-
98
-
99
-
100
-
101
-
102
-
103
-
104
-
105
-
106
-
107
-
108
-
109
-
110
-
111
-
112
-
113
-
114
-
115
-
116
-
117
-
118
-
119
-
120
-
121
-
122
-
123
-
124
-
125
-
126
-
127
-
128
-
129
-
130
-
131
-
132
-
133
-
134
-
135
-
136
-
137
-
138
-
139
-
140
-
141
-
142
-
143
-
144
-
145
-
146
-
147
-
148
-
149
-
150
-
151
-
152
-
153
-
154
-
155
-
156
-
157
-
158
-
159
-
160
-
161
-
162
-
163
-
164
-
165
-
166
-
167
-
168
-
169
-
170
-
171
-
172
-
173
-
174
-
175
-
176
-
177
-
178
-
179
-
180
-
181
-
182
-
183
-
184
-
185
-
186
-
187
-
188
-
189
-
190
-
191
-
192
-
193
-
194
-
195
-
196
-
197
-
198
-
199
-
200
-
201
-
202
-
203
-
204
-
205
-
206
-
207
-
208
-
209
-
210
-
211
-
212
-
213
-
214
-
215
-
216
-
217
-
218
-
219
-
220
-
221
-
222
-
223
-
224
-
225
-
226
-
227
-
228
 |
 |
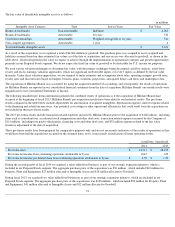
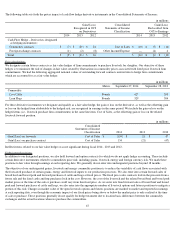
Tangible Equity Units
In July 2014, we completed the public issuance of 30 million , 4.75% tangible equity units (TEUs). Total proceeds, net of underwriting
discounts and other expenses, were $1,454 million . Each TEU, which has a stated amount of $50 , is comprised of a prepaid stock purchase
contract and a senior amortizing note due July 15, 2017. We allocated the proceeds from the issuance of the TEUs to equity and debt based on
the relative fair values of the respective components of each TEU. The fair value of the prepaid stock purchase contracts, which was $1,295
million , is recorded in Capital in Excess of Par Value, net of issuance costs. The fair value of the senior amortizing notes, which was $205
million , is recorded in debt, of which $65 million is current. Issuance costs associated with the TEU debt was recorded as deferred financing
costs in the Consolidated Balance Sheets in Other Assets and is amortized over the term of the instrument to July 15, 2017.
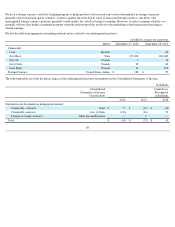
The aggregate values assigned upon issuance of each component of the TEU's, based on the relative fair value of the respective components of
each TEU, were as follows:
Each senior amortizing note has an initial principal amount of $6.83 and bears interest at 1.5% per annum. On each January 15, April 15, July
15 and October 15, commencing on October 15, 2014, we will pay equal quarterly cash installments of $0.59 per amortizing note (except for
the October 15, 2014 installment payment, which will be $0.46 per amortizing note), which cash payment in the aggregate (principal and
interest) is equivalent to 4.75% per year with respect to the $50 stated amount per TEU. Each installment will constitute a payment of interest
and partial repayment of principal. Unless settled earlier at the holder's or the Company's option, each purchase contract will automatically
settle on July 15, 2017, subject to postponement in certain limited circumstances. We will deliver between a minimum of 31.7 million shares
and a maximum of 39.7 million
shares of our Class A stock, subject to adjustment, based upon the Applicable Market Value (as defined below)
of our Class A stock as described below:
The "Applicable Market Value" means the average of the closing prices of our Class A stock on each of the 20 consecutive trading days
beginning on, and including, the 23rd scheduled trading day immediately preceding July 15, 2017.
The TEUs have a dilutive effect on our earnings per share. The 31.7 million minimum shares to be issued are included in the calculation of
Class A Basic weighted average shares. The 8 million share difference between the minimum shares and the 39.7 million maximum shares are
potentially dilutive securities, and accordingly, are included in our diluted earnings per share on a pro rata basis to the extent the Applicable
Market Value is higher than the reference price but is less than the conversion price.
61
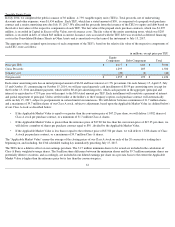
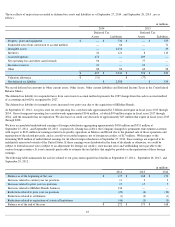
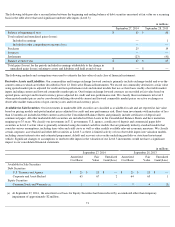
in millions, except price per TEU
Equity
Component
Debt Component
Total
Price per TEU
$
43.17
$
6.83
$
50.00
Gross Proceeds
1,295
205
1,500
Issuance cost
(40
)
(6
)
(46
)
Net proceeds
$
1,255
$
199
$
1,454
• If the Applicable Market Value is equal to or greater than the conversion price of $47.25 per share, we will deliver 1.0582 shares of
Class A stock per purchase contract, or a minimum of 31.7 million Class A shares.
• If the Applicable Market Value is greater than the reference price of $37.80 but less than the conversion price of $47.25 per share, we
will deliver a number of shares per purchase contract equal to $50 , divided by the Applicable Market Value.
• If the Applicable Market Value is less than or equal to the reference price of $37.80 per share, we will deliver 1.3228 shares of Class
A stock per purchase contract, or a maximum of 39.7 million Class A shares.